
vision stream
An India-focused market dashboard with breakout scans, technical charts, sector heat maps and a manual portfolio tracker.
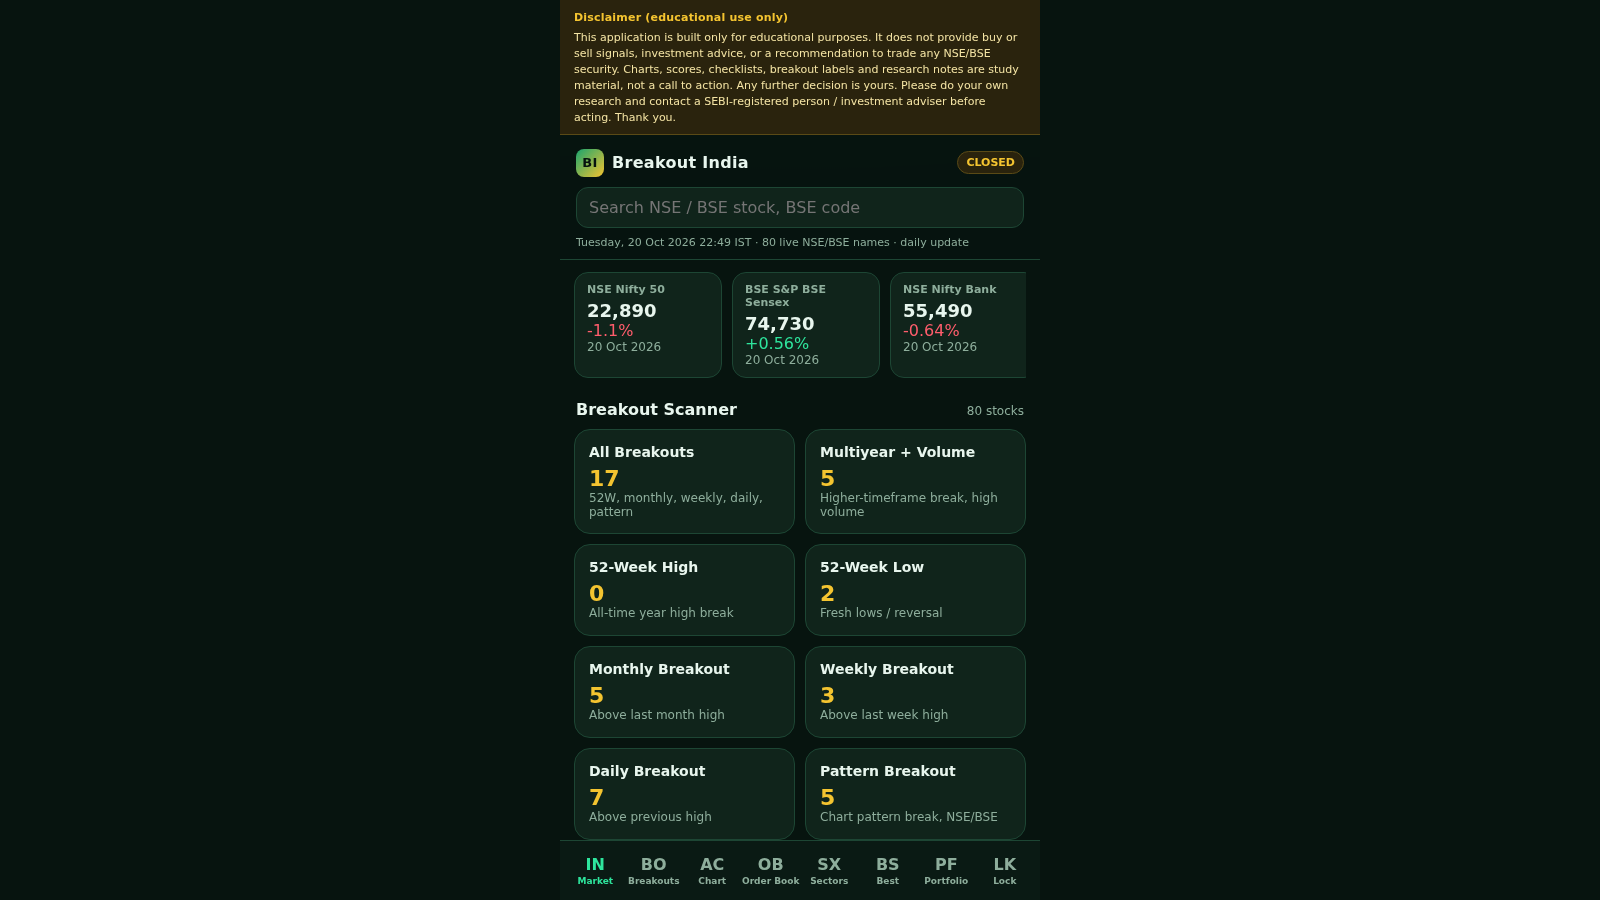
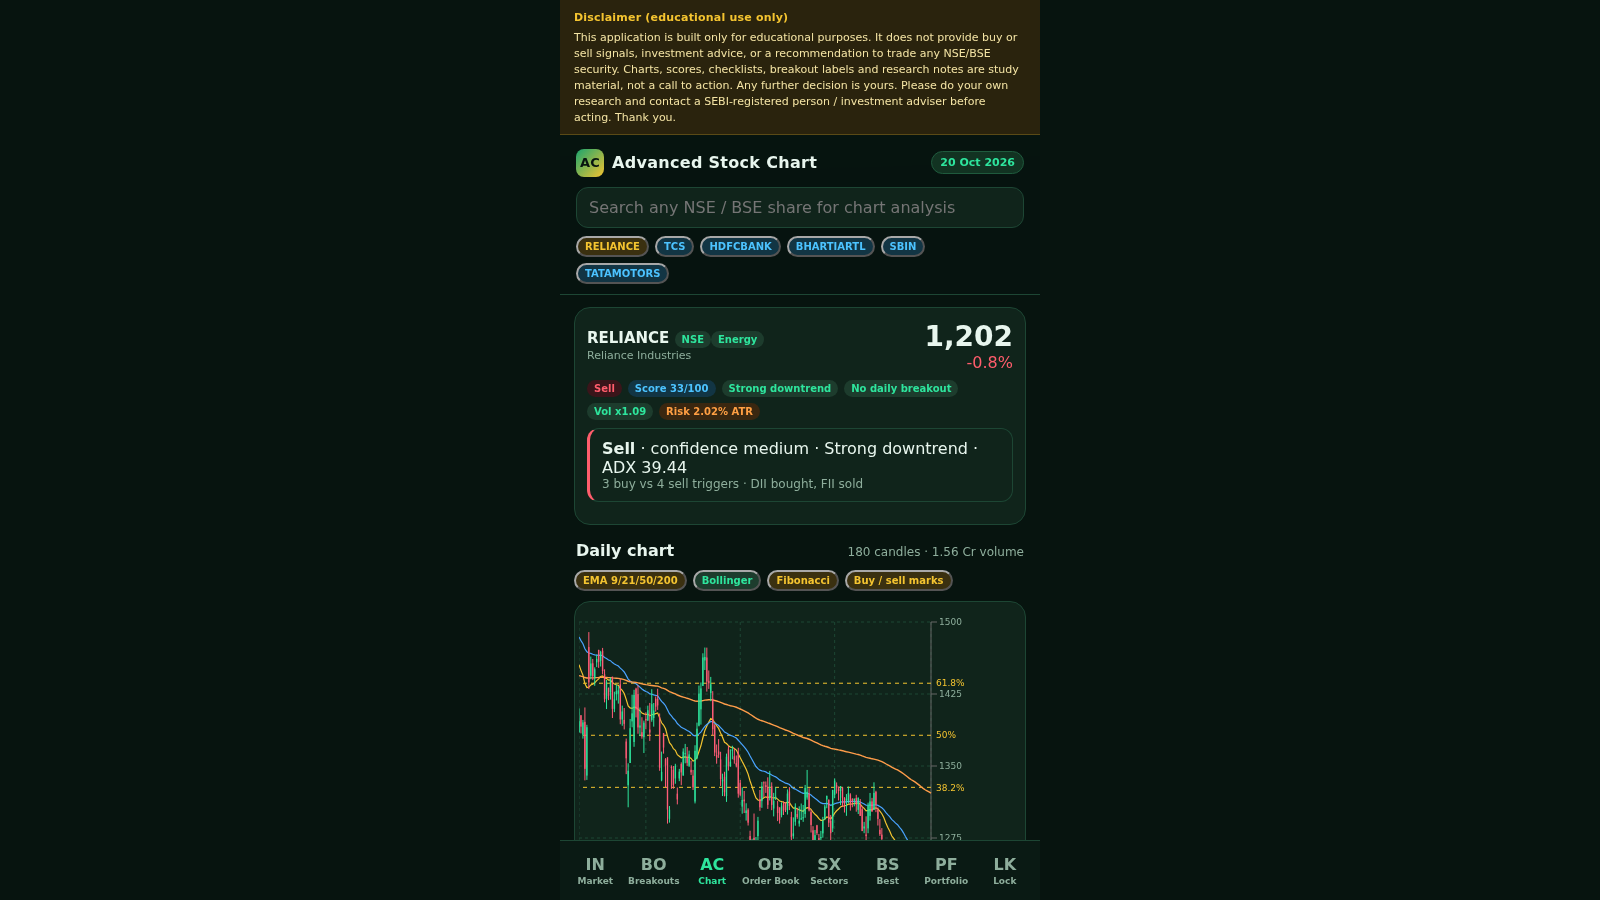
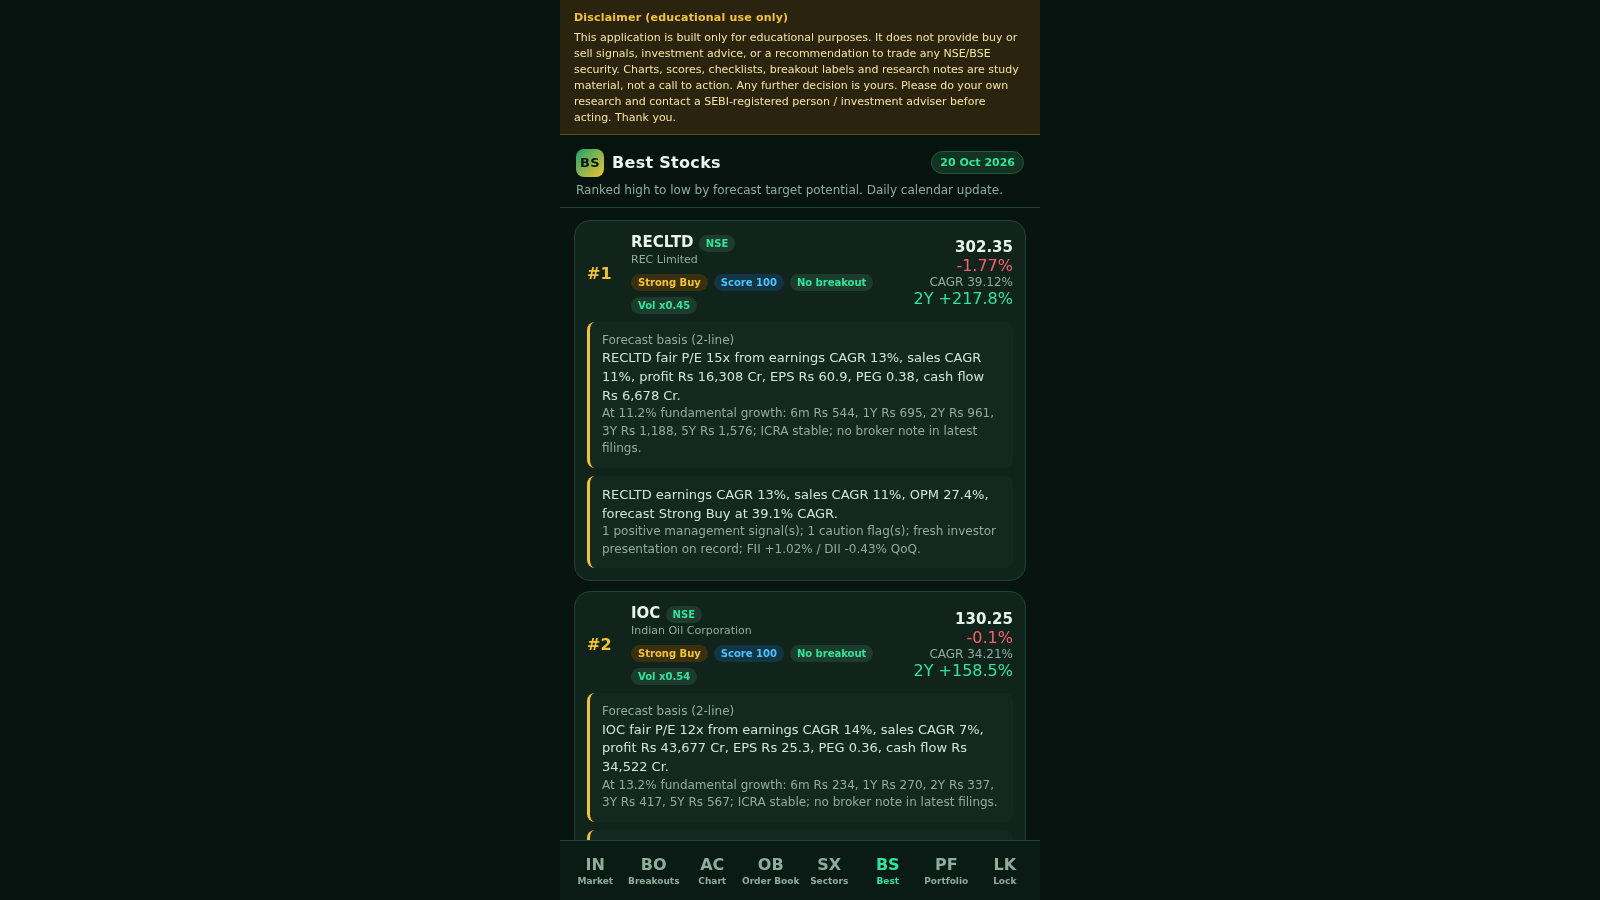
Breakout India is a browser-based research dashboard for stocks listed on NSE and BSE. The home screen shows six index snapshots, a breakout scanner with eight categories, market breadth and a top 52-week highs block. Separate sections list breakout candidates, rank stocks by forecast potential, organize sectors by daily performance, and rank companies by order value. The advanced chart page loads a symbol with a buy or sell score, candlestick chart, EMA, Bollinger and Fibonacci overlays, volume, RSI, MACD, a technical read table, a checklist, triggered signals, breakout levels, Fibonacci and pivot maps, institutional flow, multi-year forecasts and fundamentals. A manual portfolio page tracks holdings, and a device lock can protect the locally stored profile with a password or fingerprint.
Highlights
Breakout scanner
Eight breakout tabs
Technical charts
Candles + indicators
Sector heat map
25 sector rankings
Best stock ranking
Forecast-ranked list
Order book view
Order value Ranks
Portfolio tracker
Manual holdings list
How to Use
Create a local profile
Open the sign-in screen and switch to Create. Enter an email, a password with at least eight characters, a recovery question and its answer, then submit. The page states that these details are stored only in this browser, and after creation the market dashboard opens.
Read the market overview
Use the home screen to review the six index cards for Nifty 50, Sensex, Nifty Bank, Nifty Financial, Nifty Midcap 100 and India VIX. The Breakout Scanner below shows counts for each breakout category, and Market Breadth shows the number of advancing and declining names for the day.
Open a stock chart
Go to the Chart tab and choose one of the quick symbols or type a name into the search field. The selected stock page shows its price, score, trend and risk, followed by the daily candlestick chart. Buttons above the chart switch EMA, Bollinger Bands, Fibonacci levels and buy or sell marks on and off.
Explore rankings and sectors
The Breakouts page groups stocks by breakout type with tab filters. The Best page orders companies by forecast target potential, while Sectors arranges sector cards by daily gain, and Order Book ranks companies by present order value with a monthly breakdown.
Track holdings and lock the device
Open Portfolio, search for a stock, enter the number of shares and the average buying price to add a manual holding. Totals for invested value, present value, profit and loss then update. The Lock button in the bottom navigation signs the profile out and offers password or fingerprint protection on the device.
Similar Sites
 28
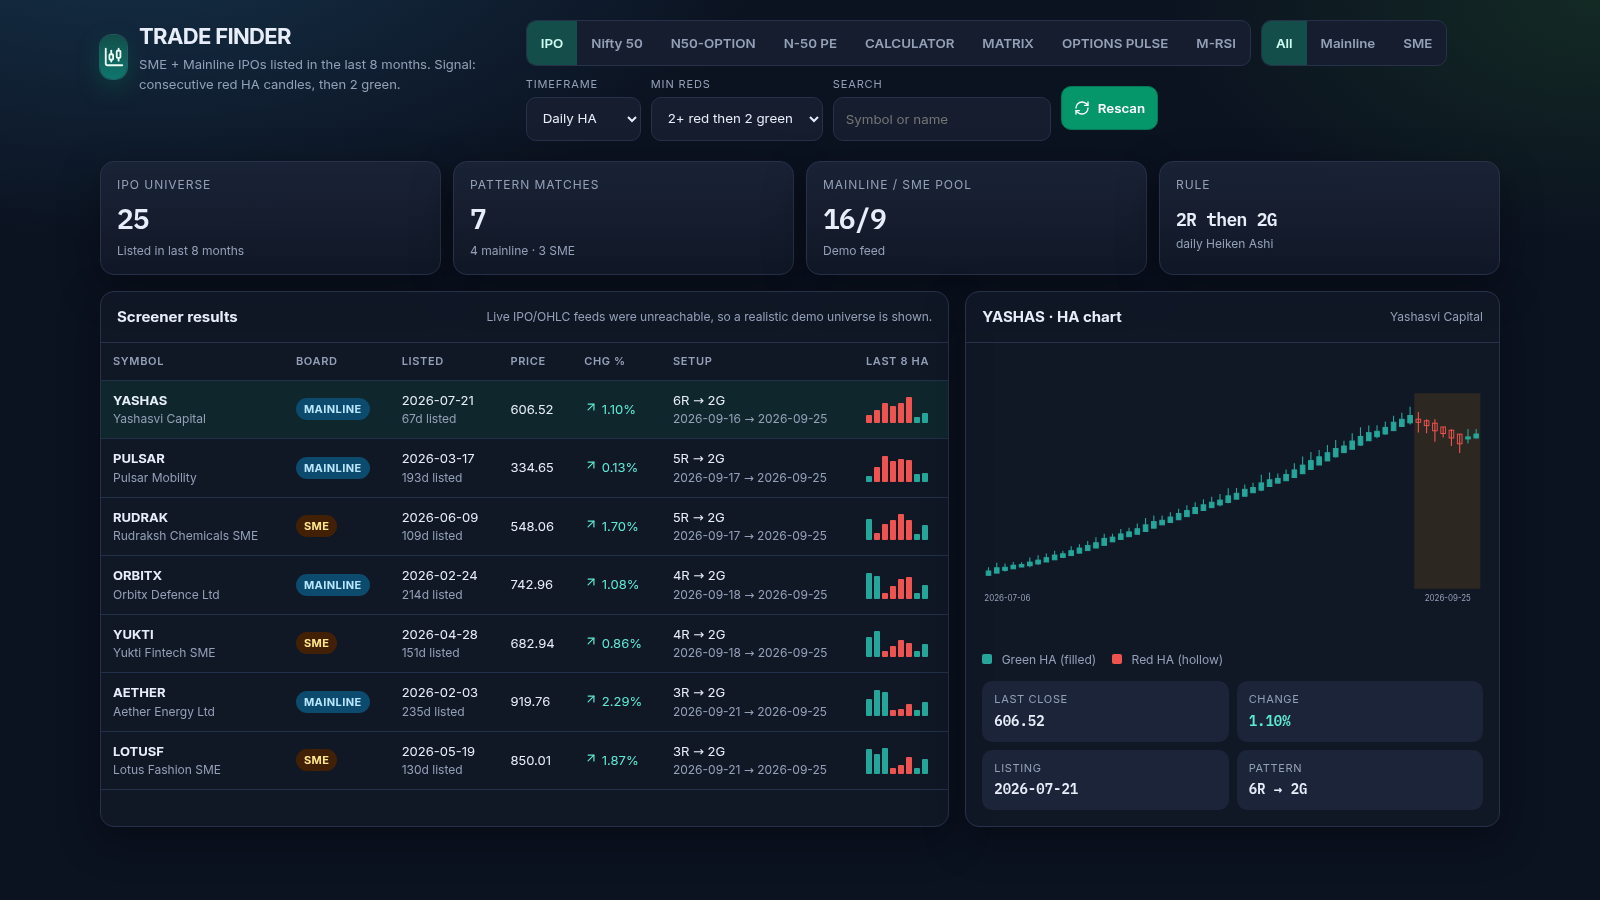
TRADE FINDER
India market dashboard: HA IPO/Nifty, options, MATRIX, pulse, M-RSI, calculator
 31
HemoVision AI
AI optical research and emergency blood-resource management.
 31
CreatrixAI — AI Content Studio
AI workspace for YouTube creators: ideas, scripts, titles, thumbnails.
 11
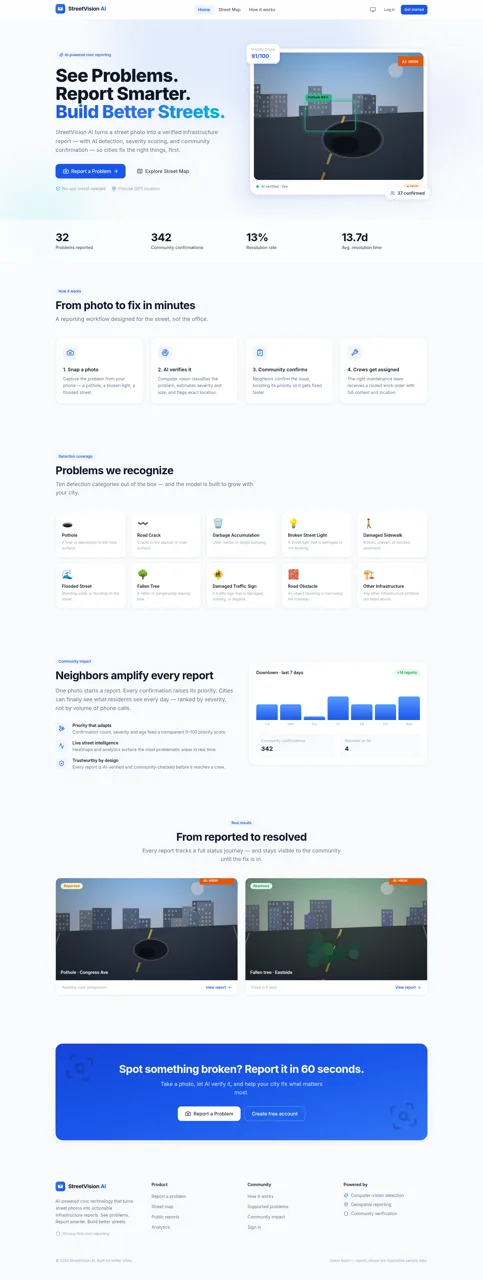
StreetVision AI
See Problems. Report Smarter.
 8
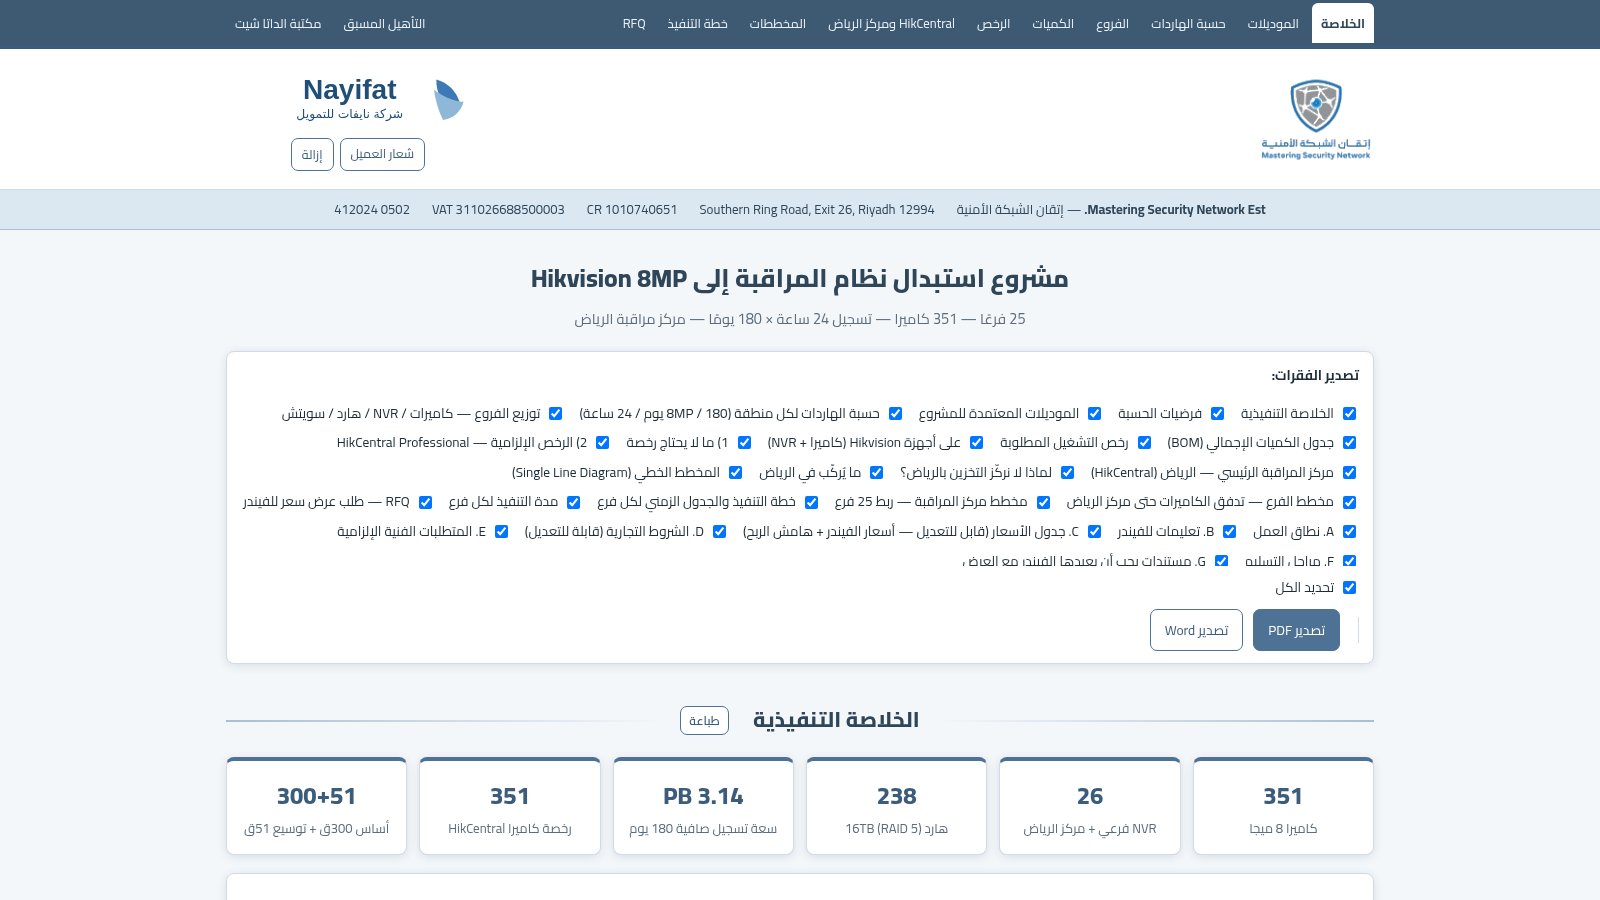
Nayifat CCTV Hikvision 8MP
Hikvision 8MP CCTV report for Nayifat — 25 branches, 351 cameras, 16TB RAID5
 7
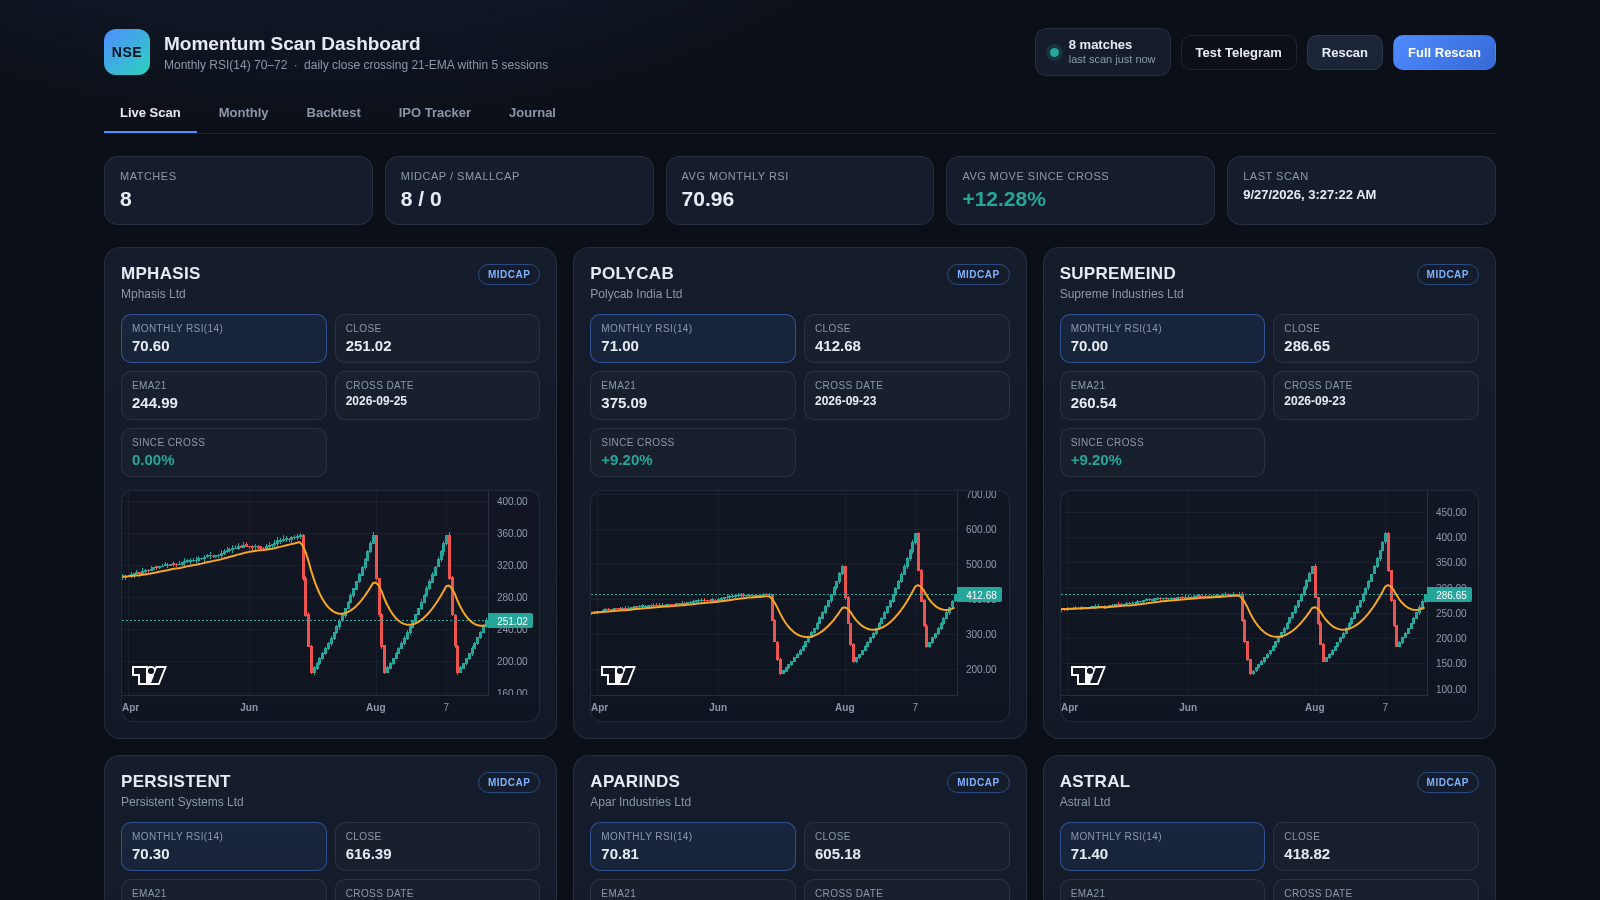
NSE Momentum Scan Dashboard
Scans NSE stocks for monthly RSI 70-72 with a recent daily 21-EMA breakout.