
Stock Analysis Engine
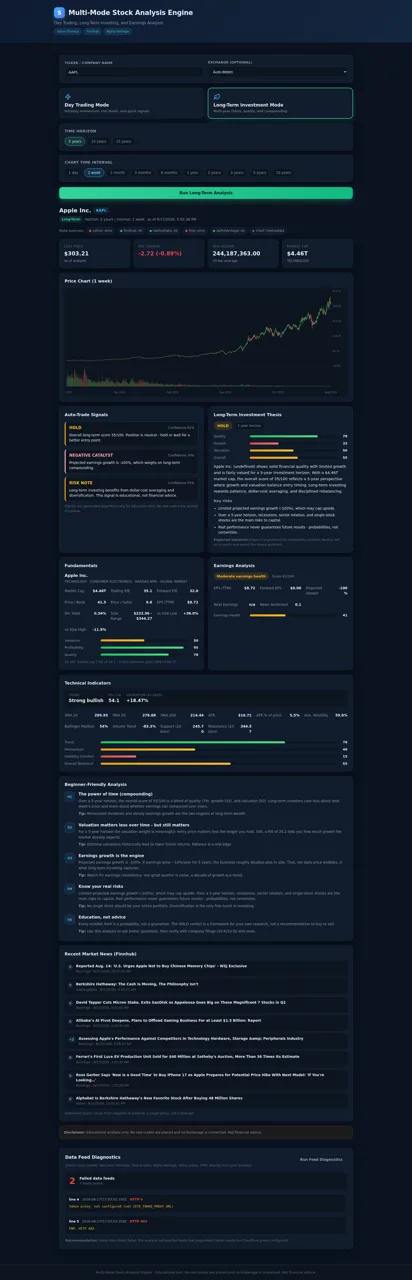
Run configurable day-trading or long-term stock research from one multi-source dashboard.
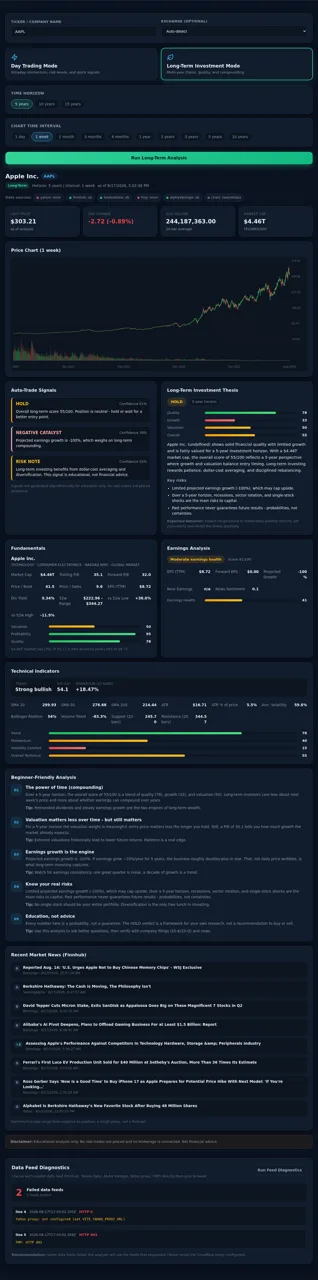
Stock Analysis Engine is an interactive educational equity research tool. Users enter a ticker or company name, optionally select a global exchange, and choose either a day-trading workflow or a long-term investment workflow. Day-trading analysis combines a risk profile and chart interval with live pricing, market structure, trendlines, momentum, technical indicators, algorithmic signals, position sizing, stop and target levels, fundamentals, earnings, analyst data, and recent news. Long-term analysis uses a selected investment horizon and chart period to produce quality, growth, valuation, and overall scores, a thesis, key risks, earnings context, and beginner-friendly explanations. A separate diagnostics action checks five market-data feeds and reports which sources are available. The site repeatedly states that its output is educational, places no trades, connects to no broker, and is not financial advice.
Highlights
Two Research Modes
Intraday and long-term
Multi-Source Data
Several live data feeds
Detailed Signals
Plans, levels, and scores
Feed Diagnostics
Provider status reporting
How to Use
Enter a security
Type a ticker or company name in the main field. Leave exchange detection automatic or choose a supported market such as the United States, United Kingdom, Germany, Japan, Hong Kong, China, or India to guide symbol resolution.
Configure day trading
Choose Day Trading Mode, select a low, medium, or high risk profile, and select a chart interval from one minute through one day. Run the analysis to receive current pricing, market structure, technical readings, signals, risk levels, and an educational trade plan.
Configure long-term research
Choose Long-Term Investment Mode, select a five, ten, or fifteen year horizon, and pick a chart period. Run the analysis to review the investment thesis, quality, growth and valuation scores, fundamentals, earnings, risks, technical context, and educational explanations.
Check source health
Use Run Feed Diagnostics to test the available market-data providers. The results identify successful and failed feeds and explain that analysis can continue with the sources that responded.
Verify before acting
Treat every generated signal as an educational research aid. Review the timestamp and source badges, verify important figures with company filings and trusted market sources, and do not interpret the output as personalized financial advice.
Similar Sites
 3
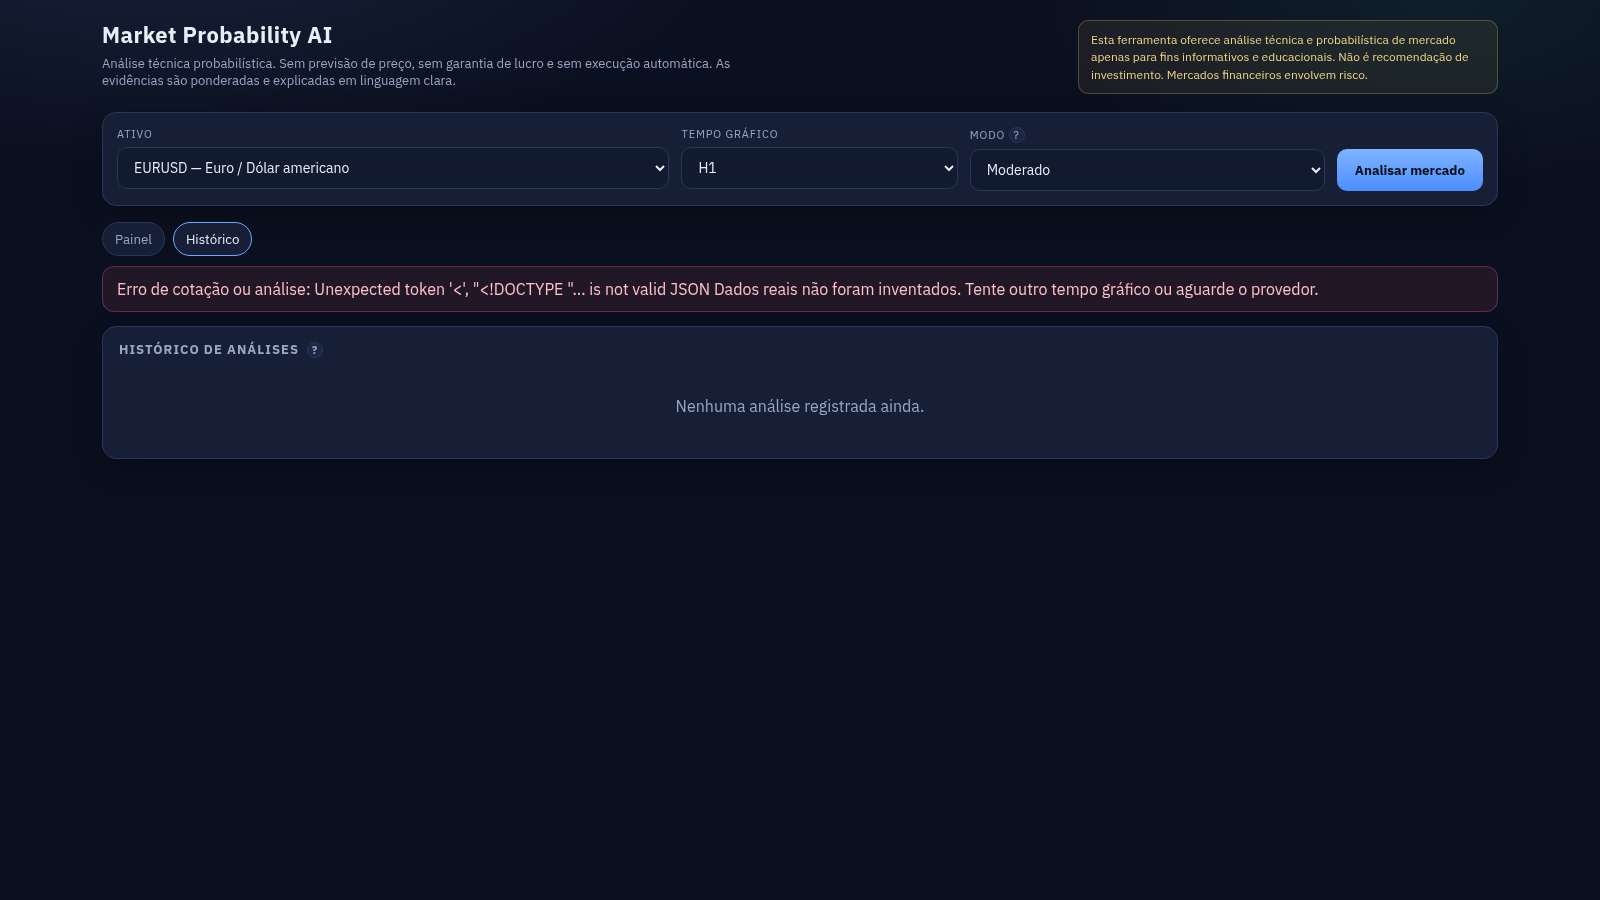
3Confluency
Análise técnica e probabilística
 29
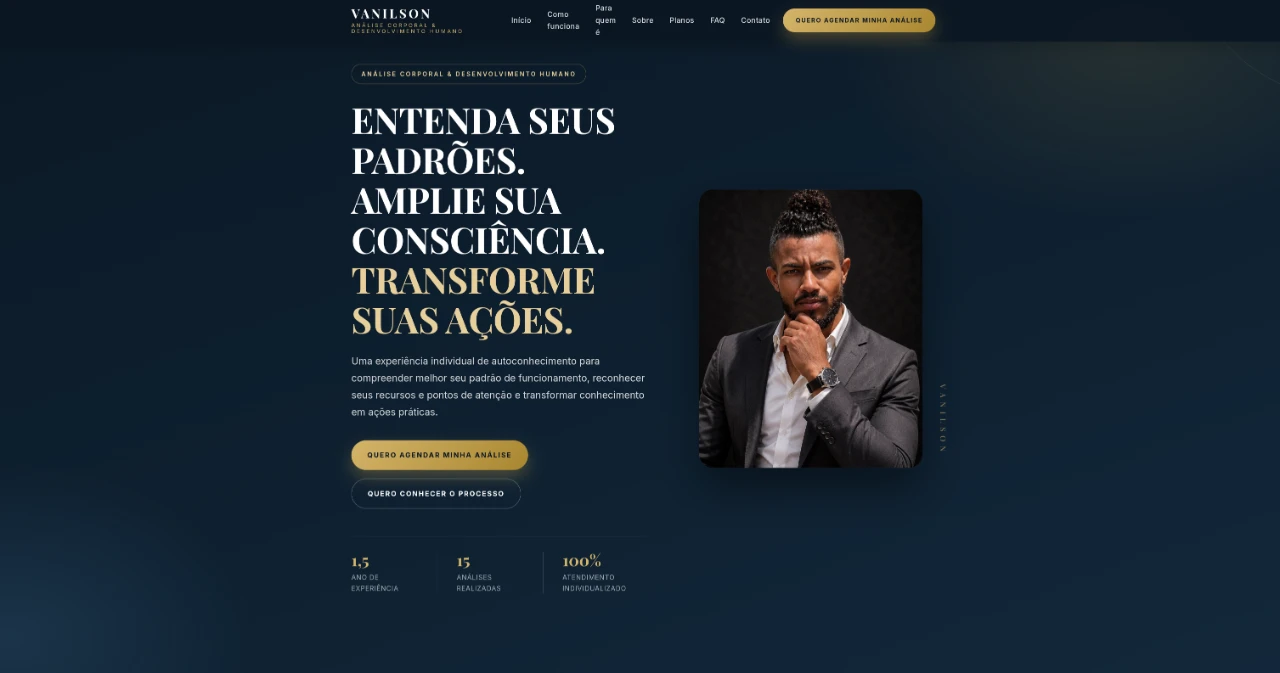
29Vanilson | Análise Corporal
Entenda seus padrões, amplie sua consciência e transforme suas ações.
 27
27Controle de Estoque
Entrada e saída de materiais com baixa automática do estoque
 22
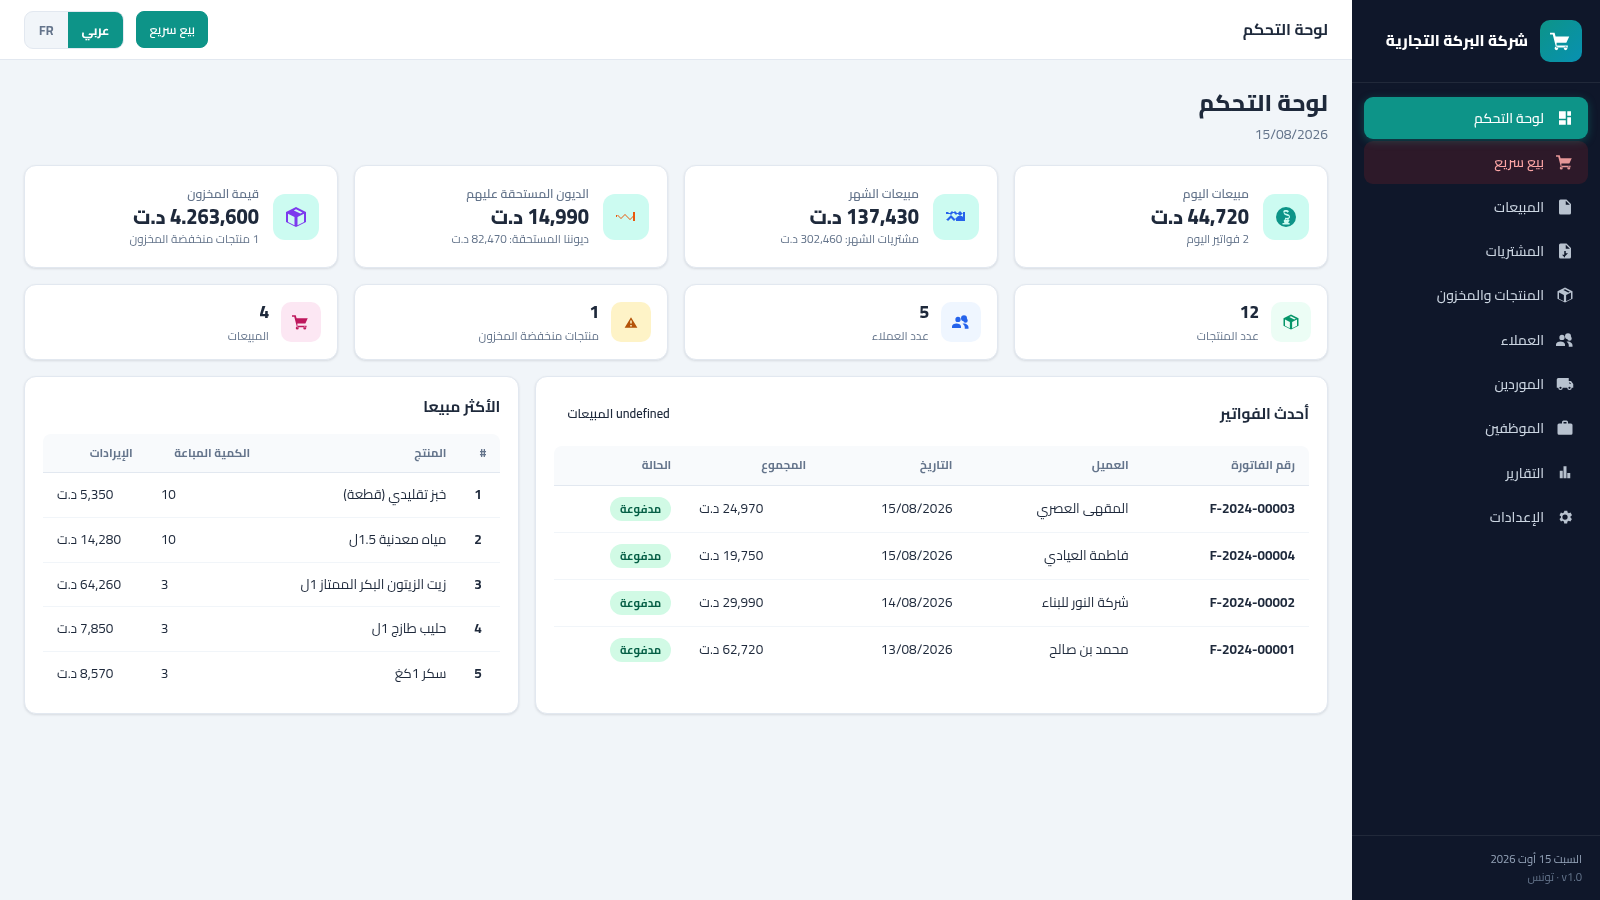
22Tunisia ERP Commercial
Gestion commerciale: ventes, achats, factures, stock, clients - dinar tunisien AR/FR
 14
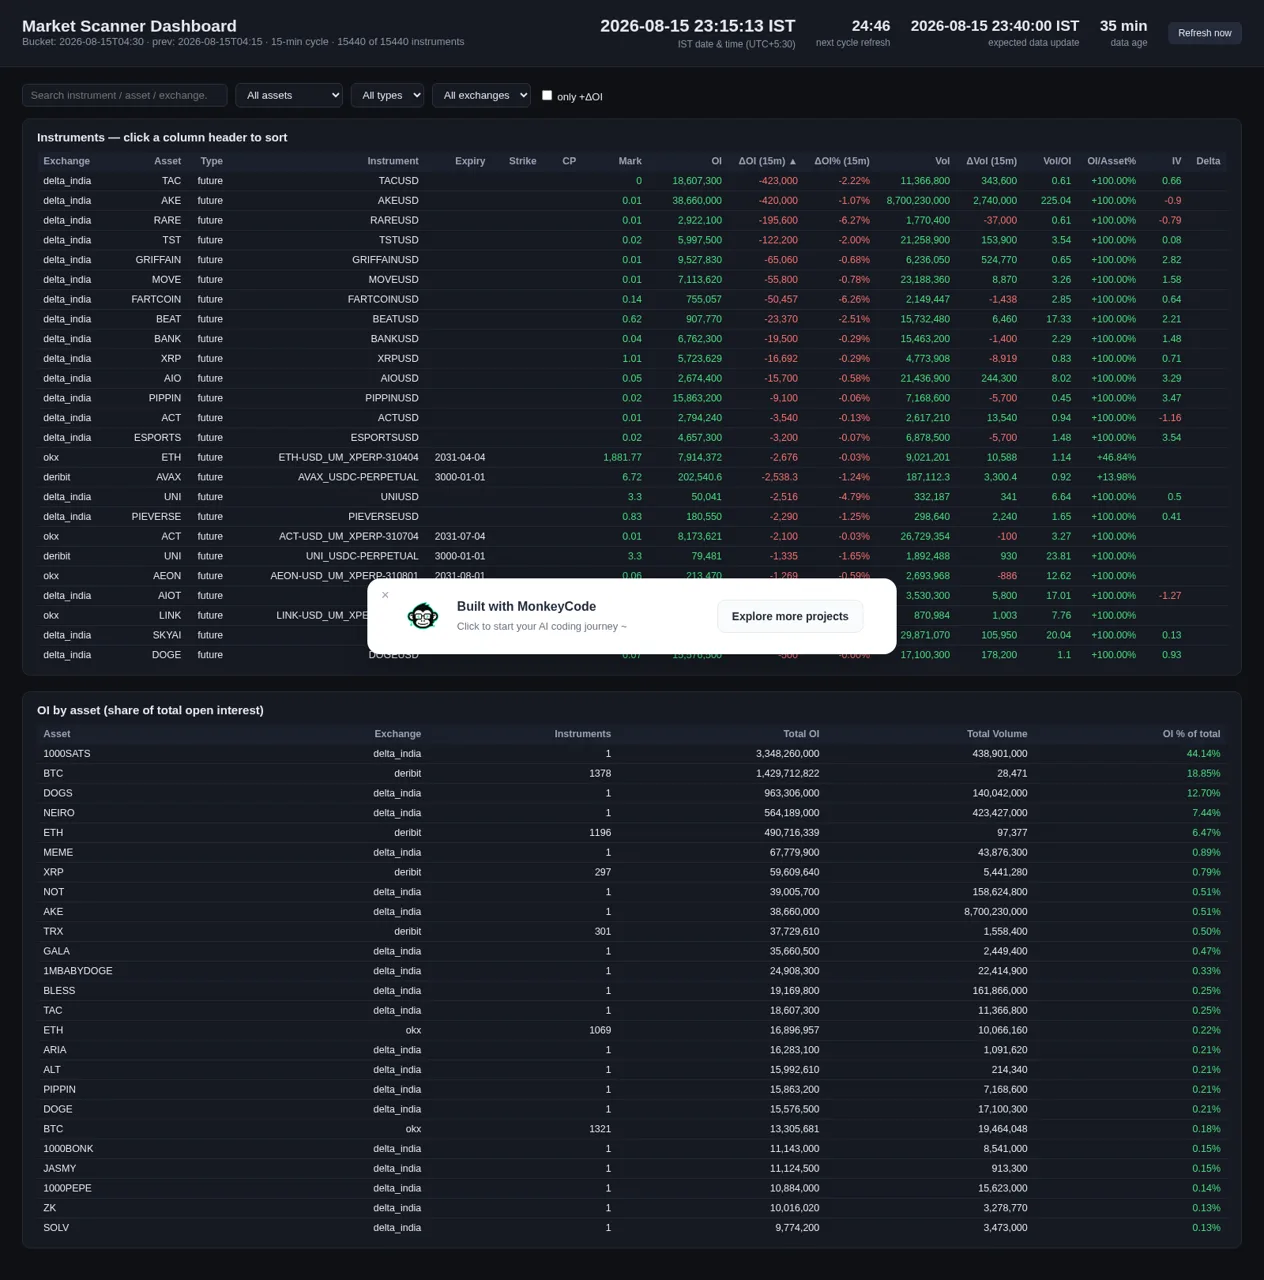
14Market Scanner Dashboard
Sortable futures/options market scanner dashboard across Deribit, OKX, Delta Exchange India and Yahoo Finance with 15-min snapshots, live IST clock and OI/volume change metrics.
 11
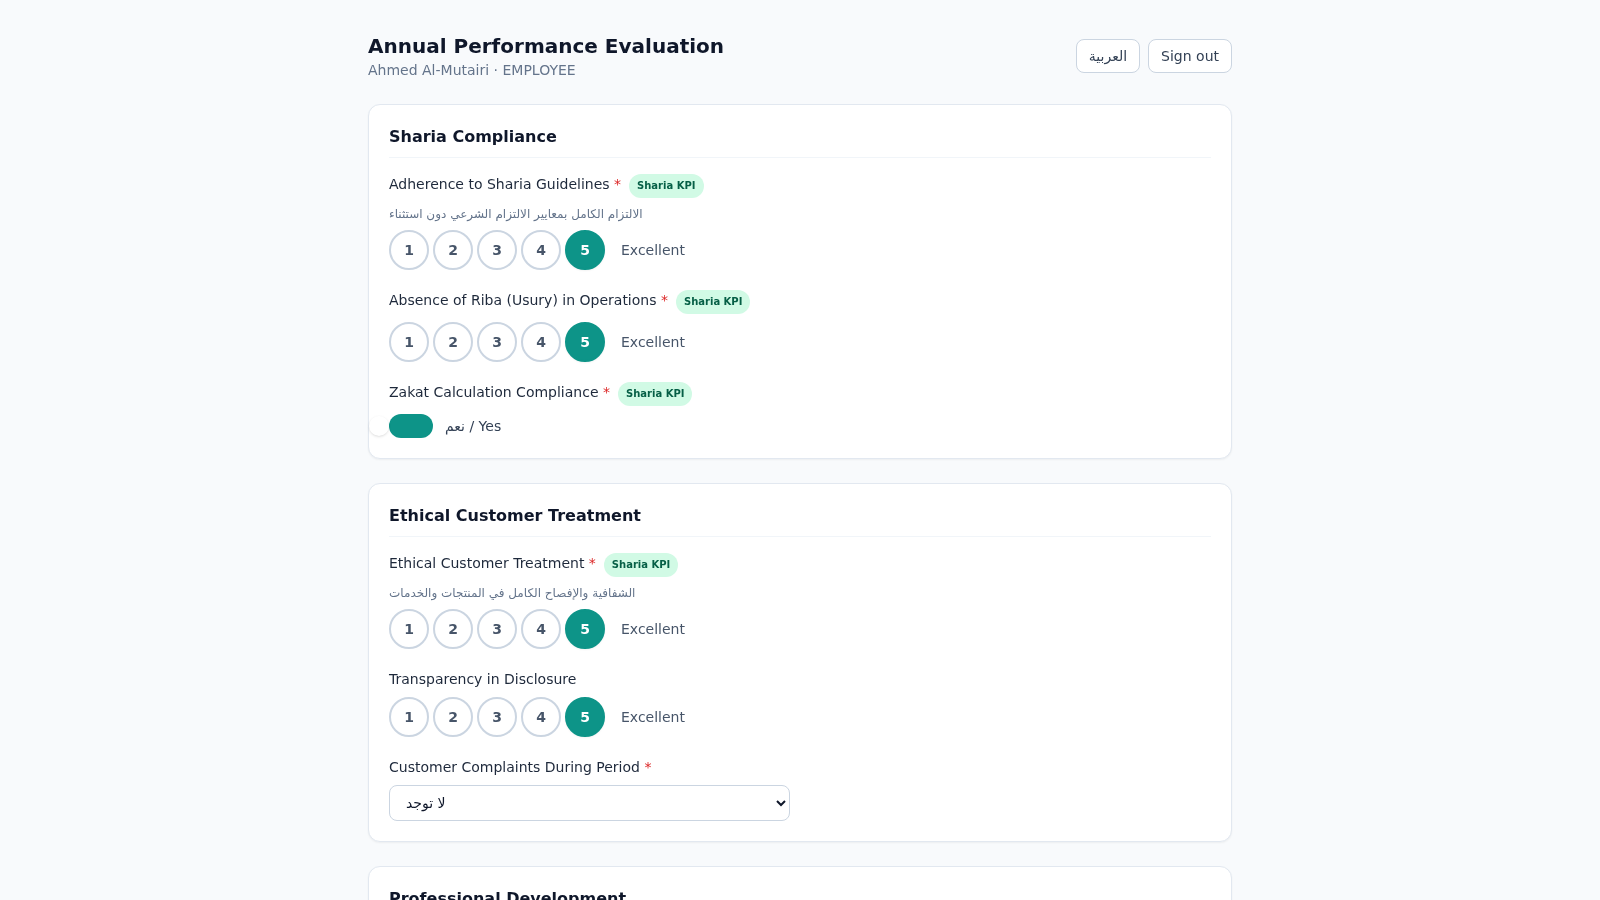
11Islamic Bank Performance Evaluation
Annual performance evaluation system for an Islamic bank: dynamic Sharia-KPI form engine, weighted scoring, immutable cryptographic audit trail, and 3-role approval workflow with Arabic/RTL support.