
GoldFlow XAUUSD
Live XAUUSD order-flow dashboard with a Bookmap-style liquidity heat map
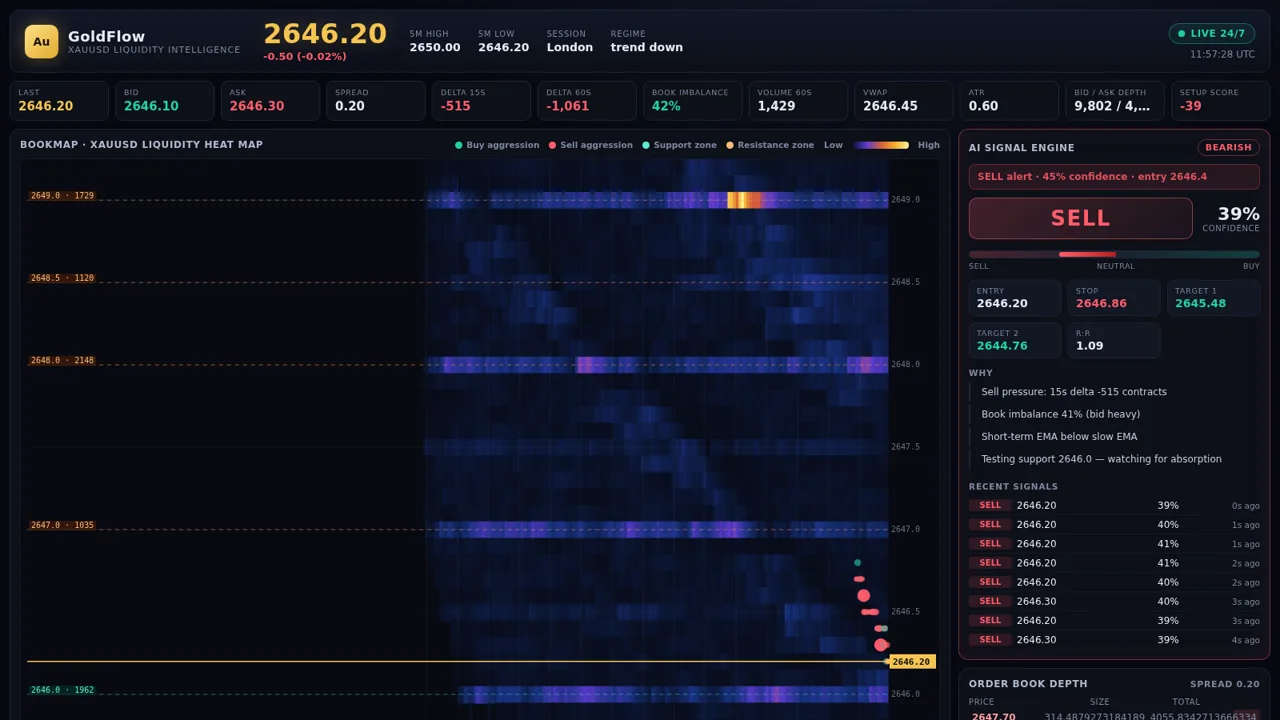
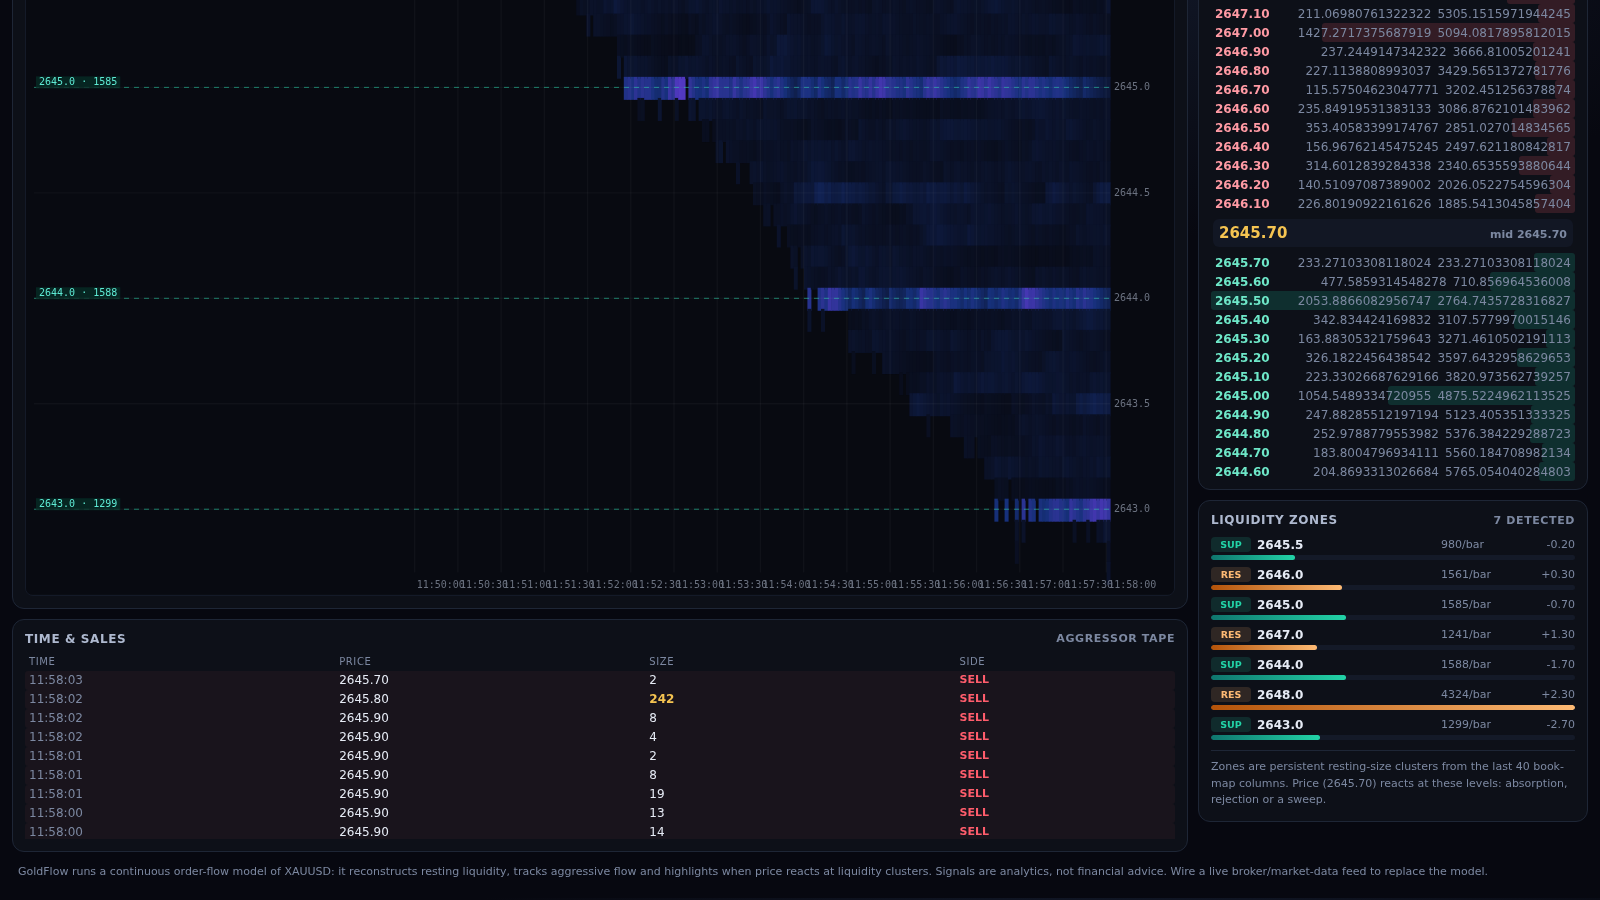
GoldFlow XAUUSD Liquidity Intelligence is a single-page trading analytics dashboard focused on short-term order flow in spot gold. On one screen it combines a live price header, a strip of microstructure metrics such as delta, book imbalance, volume, VWAP and ATR, a canvas-based liquidity heat map drawn over price and time, an AI signal engine that publishes a direction with confidence and entry, stop and target levels, an order book depth panel, a rolling time-and-sales aggressor tape, and a list of detected support and resistance liquidity zones. All of the numbers stream continuously, and the site states that the data comes from a built-in order-flow model rather than a live broker feed, so it works as a self-contained demo you can study without an account.
Highlights
Liquidity heat map
Canvas flow view
AI signal engine
Entry, stop, targets
Order book depth
Bid and ask sizes
Aggressor tape
Live time and sales
Liquidity zones
Detected S/R levels
How to Use
Open the page
Visit the site and wait for the container to start; the first load can show a short startup screen before the dashboard appears and refreshes automatically. Once loaded, no login or setup is required and the model begins streaming on its own.
Read the header metrics
Start at the top bar, which shows the current XAUUSD price, its point and percentage change, the five-minute high and low, the active session and the current regime. The strip below lists last, bid, ask, spread, fifteen-second and sixty-second delta, book imbalance, sixty-second volume, VWAP, ATR, total bid and ask depth and a setup score, all updating continuously.
Study the heat map
The large centre panel plots liquidity intensity over time and price on a canvas, with a colour scale from low to high. Green and orange markers indicate support and resistance zones, so you can see where resting size clusters around the current price and how aggressive flow builds along the price ladder.
Check the signal engine
The panel on the right shows the current AI stance, a confidence percentage, and a set of levels including entry, stop, target one, target two and the risk-reward ratio. A short why list explains the reasoning in plain sentences, and the recent signals log lists earlier alerts with their direction, price, confidence and age.
Cross-check the tape and zones
The lower half adds an order book depth table with per-level size and running totals on both sides of the mid price, a time-and-sales aggressor tape with colour-coded buy and sell prints, and a liquidity zones list. Comparing these three against the heat map and the signal reasons gives a full picture of what the model is reacting to.
Similar Sites
 51
domorroproasfaltobolsadevalores
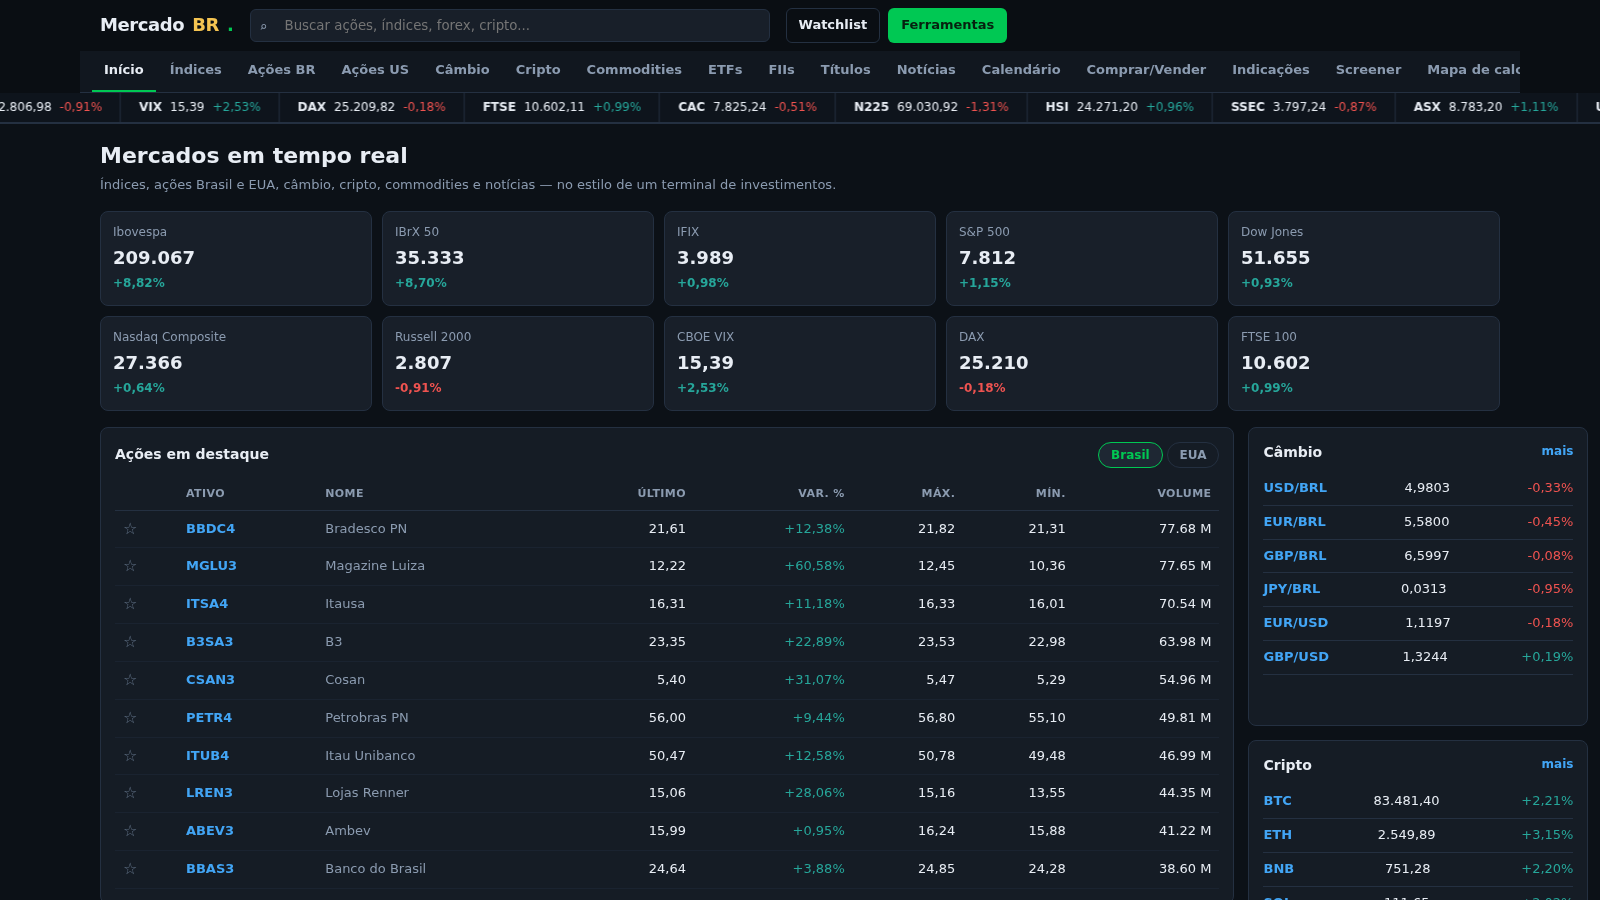
Portal de cotações B3/EUA com sinais IFR, P/L e P/VPA
 31
CreatrixAI — AI Content Studio
AI workspace for YouTube creators: ideas, scripts, titles, thumbnails.
 31
Diagnóstico de vazamento patrimonial
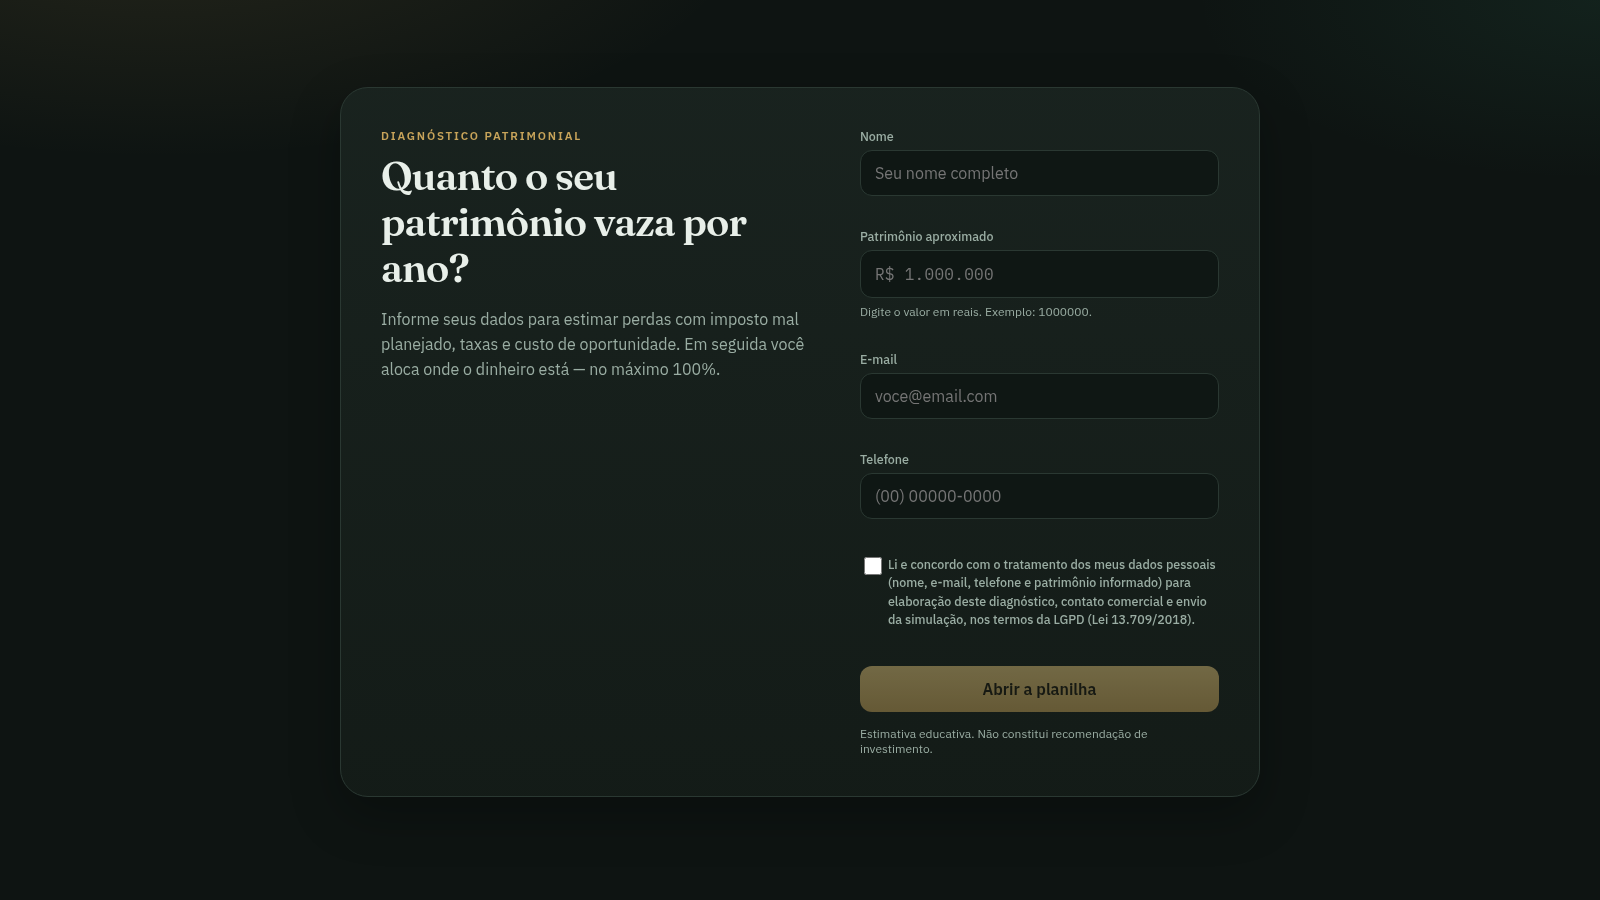
Estime quanto seu patrimônio vaza por ano com imposto, taxas e oportunidade.
 28
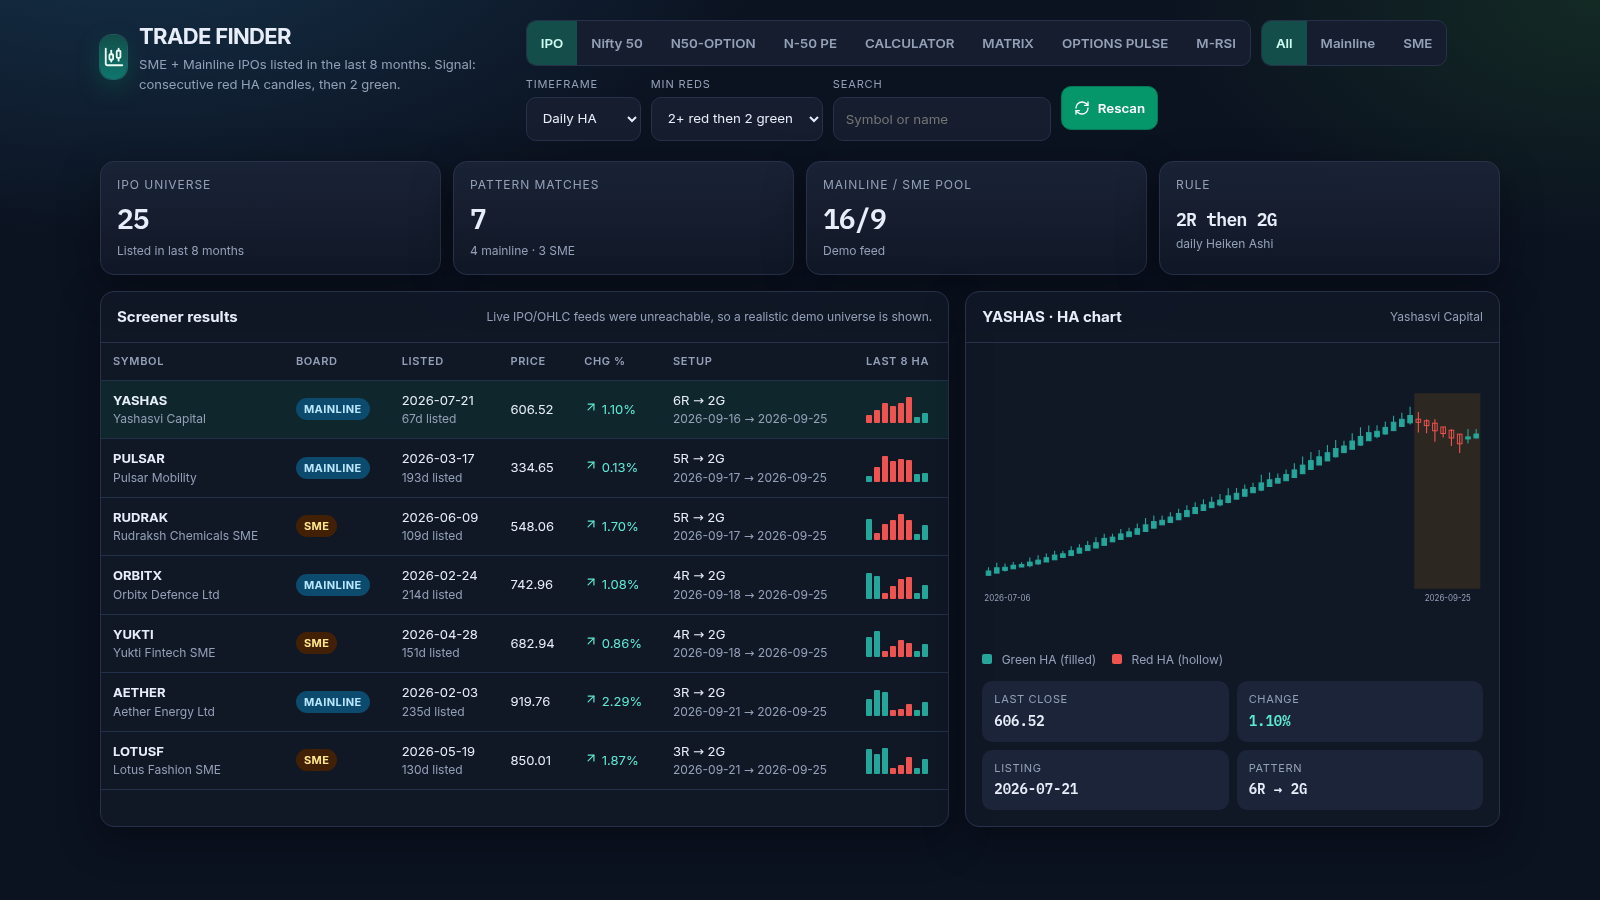
TRADE FINDER
India market dashboard: HA IPO/Nifty, options, MATRIX, pulse, M-RSI, calculator
 15
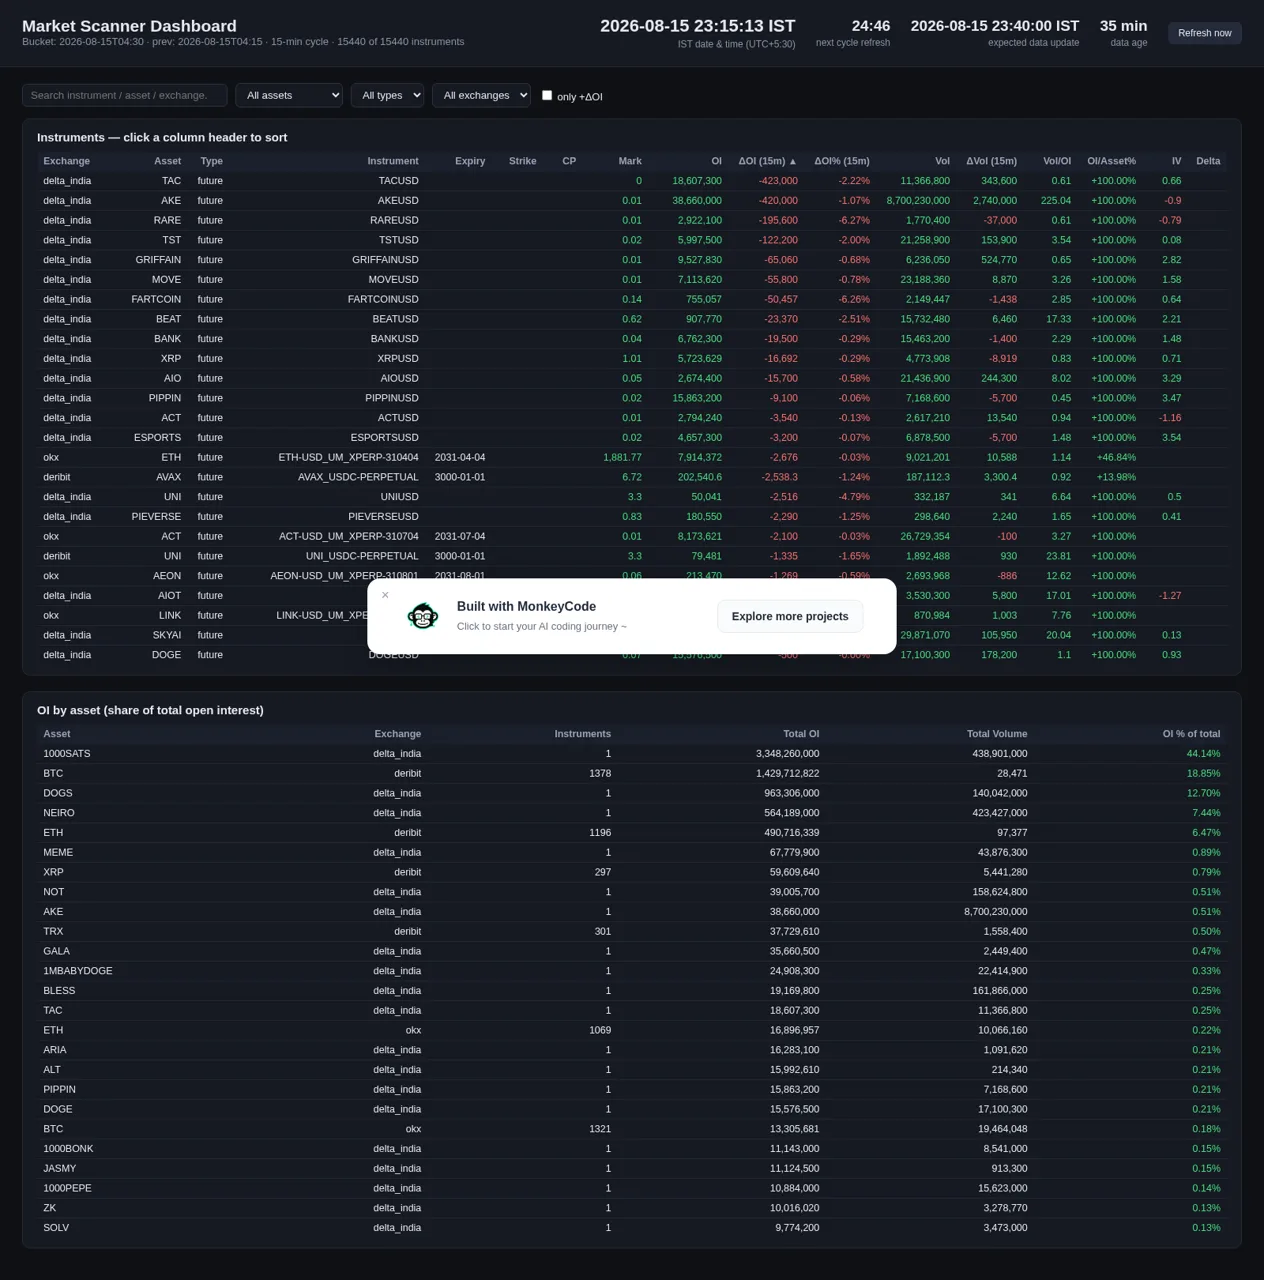
Market Scanner Dashboard
Sortable futures/options market scanner dashboard across Deribit, OKX, Delta Exchange India and Yahoo Finance with 15-min snapshots, live IST clock and OI/volume change metrics.
 14
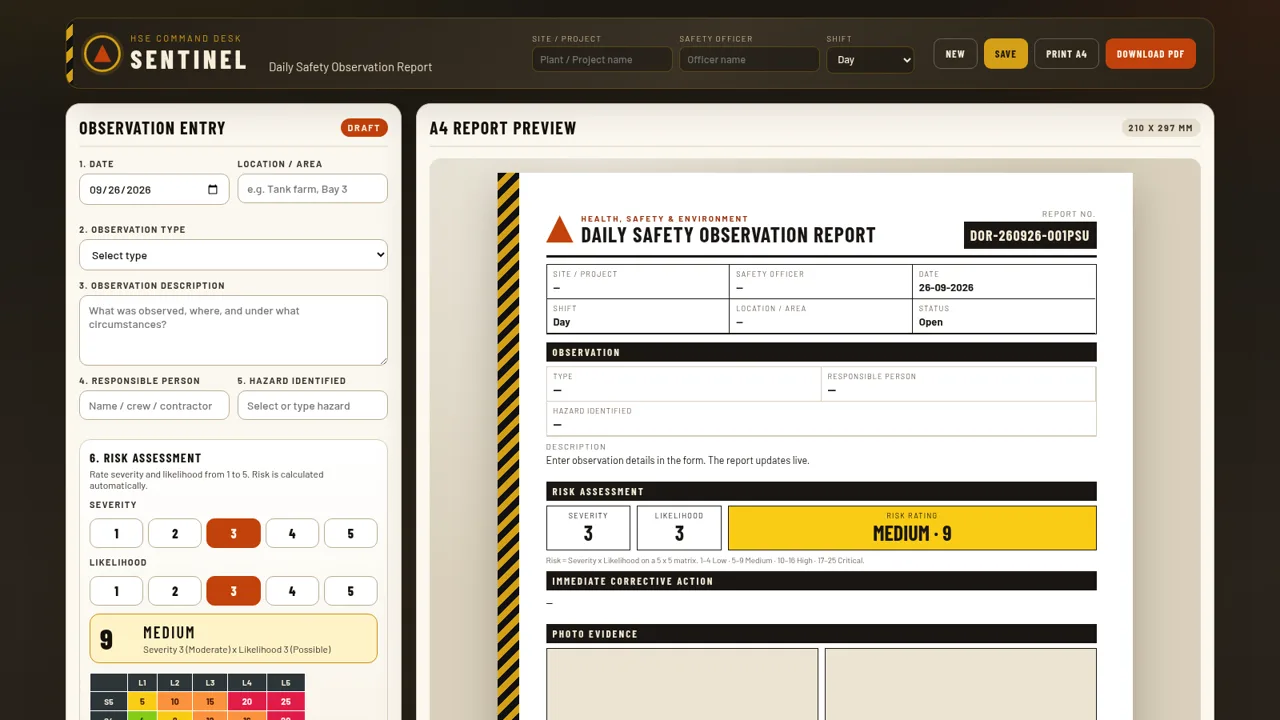
Daily observation report by RG Gafur
Daily observation report