
Universaliza Lote 08
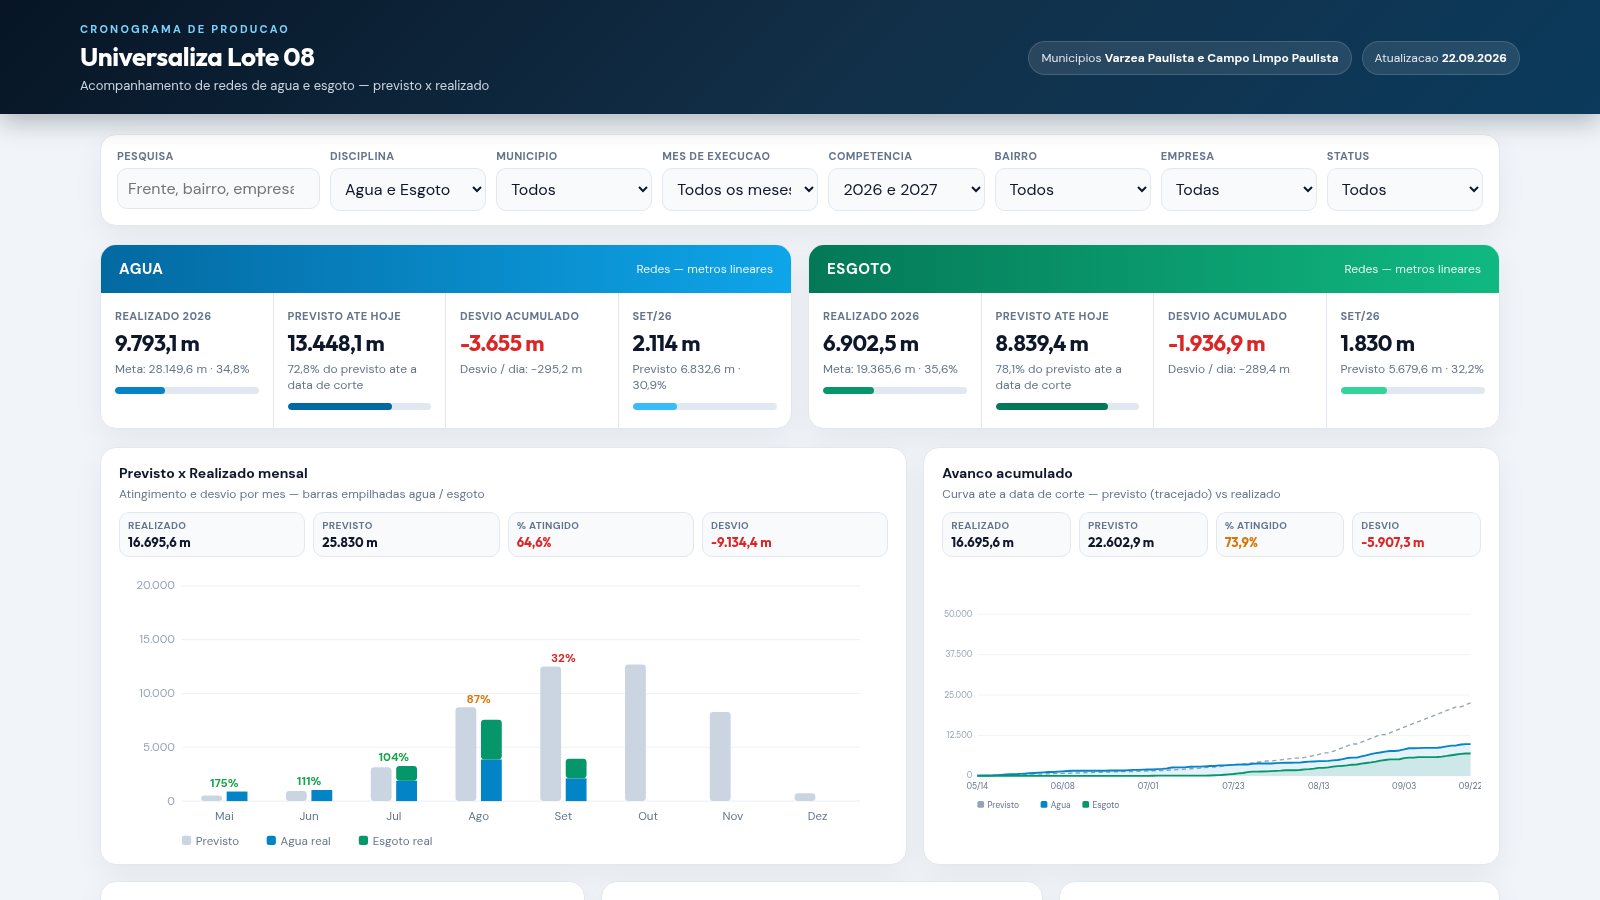
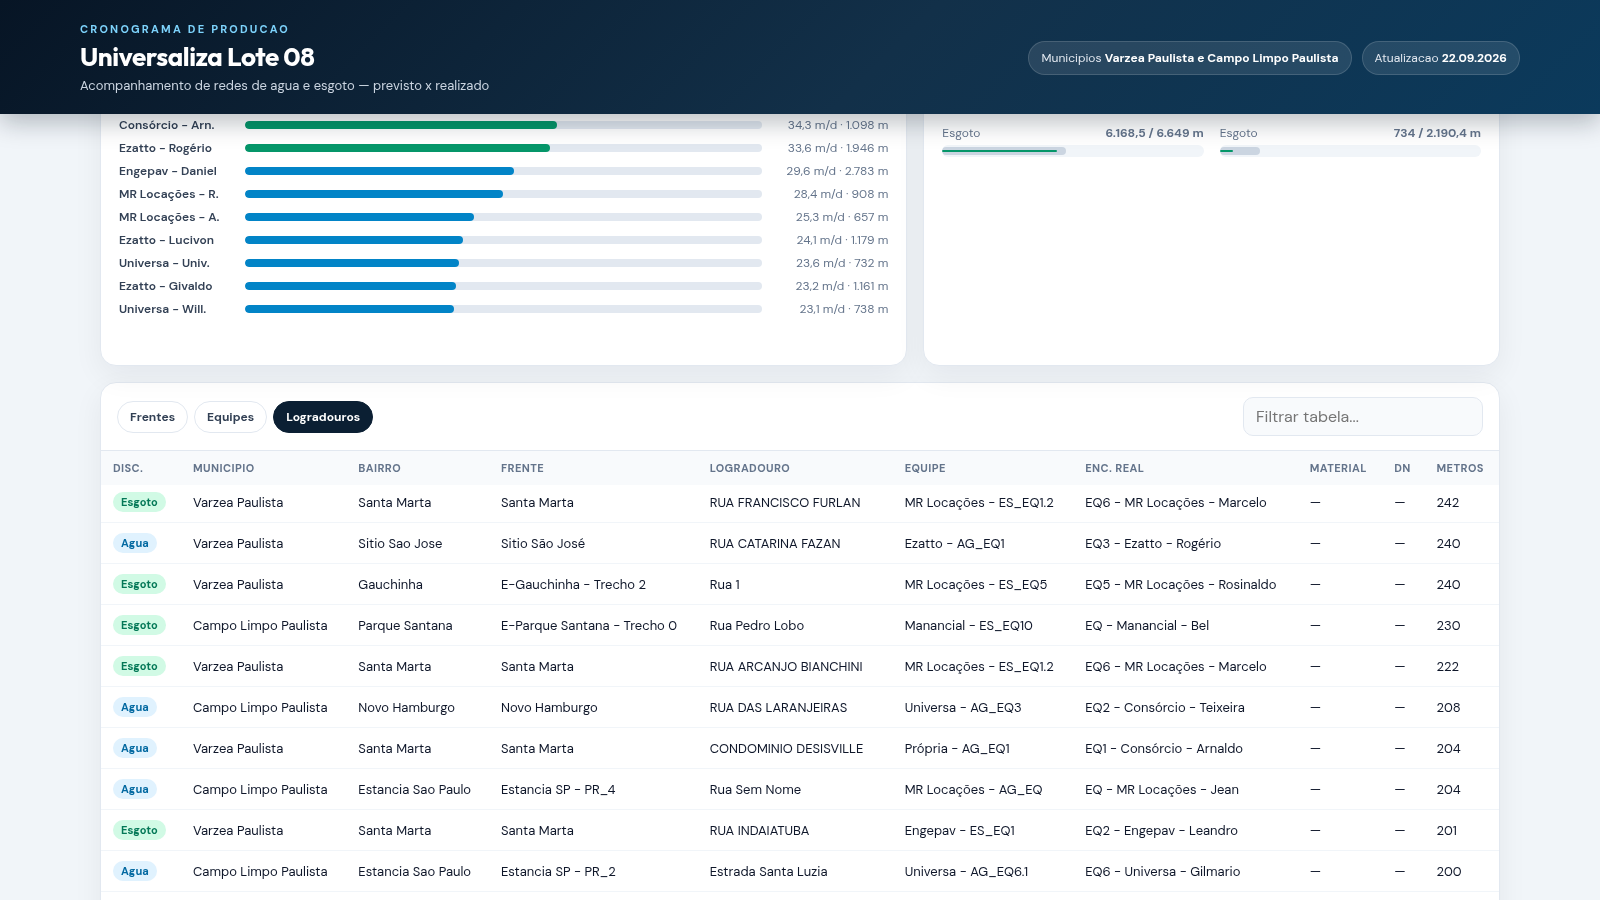
A production dashboard that compares planned versus executed water and sewage network metres for Lote 08.
Universaliza Lote 08 is a single-page dashboard that reports construction progress for water and sewage networks in the Lote 08 project, covering Varzea Paulista and Campo Limpo Paulista in Brazil. The page loads one data set and turns it into a structured progress report: headline cards summarize executed metres, the planned figure up to the cut-off date, accumulated deviation and the current month for both water and sewage. Further panels break the numbers down by month, cumulative curve, work front, contractor, city, pipe material and crew productivity, and two sections summarize environmental and land-ownership approval stages. A detailed table lists every work front with discipline, city, neighborhood, year, company, crew, foreman, planned, executed, percentage, deviation, metres per day and status. Seven filters plus a search box let users reshape the whole view.
Highlights
Planned vs executed
Water and sewage mix
Multi filter recorte
Seven dropdowns
Crew productivity
19 crews ranked
Detailed work fronts
20-row sortable list
How to Use
Read the headline cards
Open the page and start with the two cards at the top, one for AGUA and one for ESGOTO. Each card shows executed metres for 2026, the volume planned up to the cut-off date, the accumulated deviation and the current month value with its percentage of target, so you can immediately see which discipline is behind.
Filter the recorte
Use the filter row to narrow the whole dashboard. Changing Disciplina to Somente Agua or Somente Esgoto, or picking a municipality, execution month, competence, neighborhood, company or status, recalculates the panels, rankings and table on the spot; the search box above the table filters rows by free text.
Explore the analysis panels
Scroll through the monthly stacked bars, the cumulative curve, and the rankings by work front, company, city and pipe material. Each panel shows its own summary counters such as realized volume, percentage attained and deviation, so you can compare where the gap is concentrated before reading individual rows.
Inspect the detail table
The table at the bottom lists each work front with discipline, city, neighborhood, year, company, crew, foreman, planned, executed, percentage of target, deviation, metres per day and status. Click any column header to sort, and switch between the Frentes, Equipes and Logradouros views to change how the same data is grouped.
Similar Sites
 4
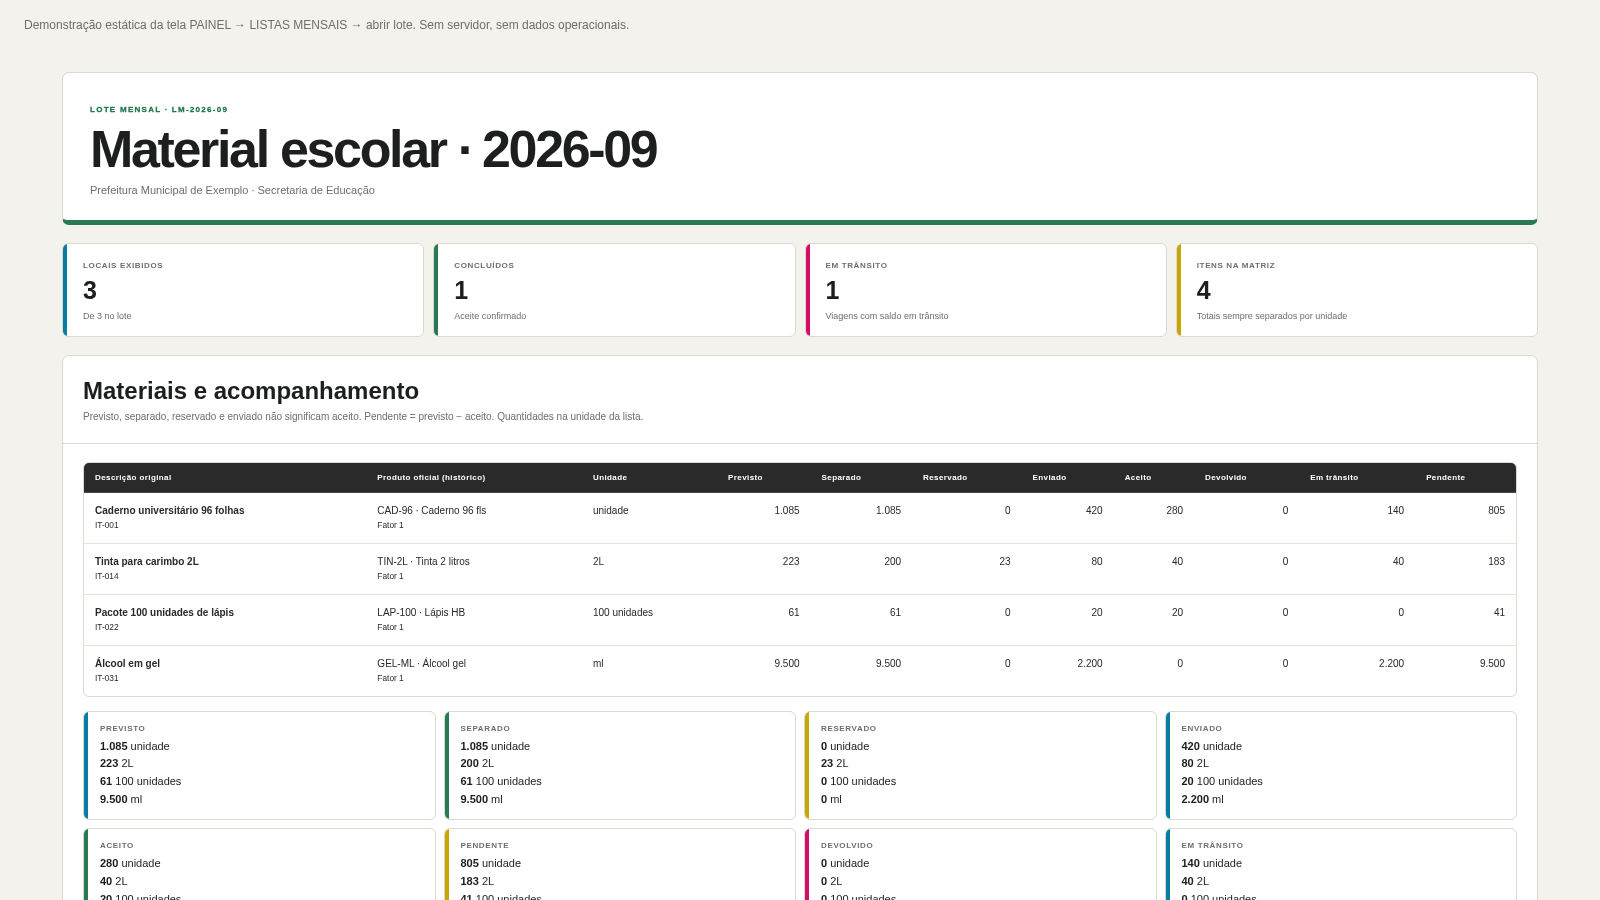
Comercial Lobo Listas Mensais
Painel de lote mensal: resumo por unidade e destinos físicos expansíveis.
 420
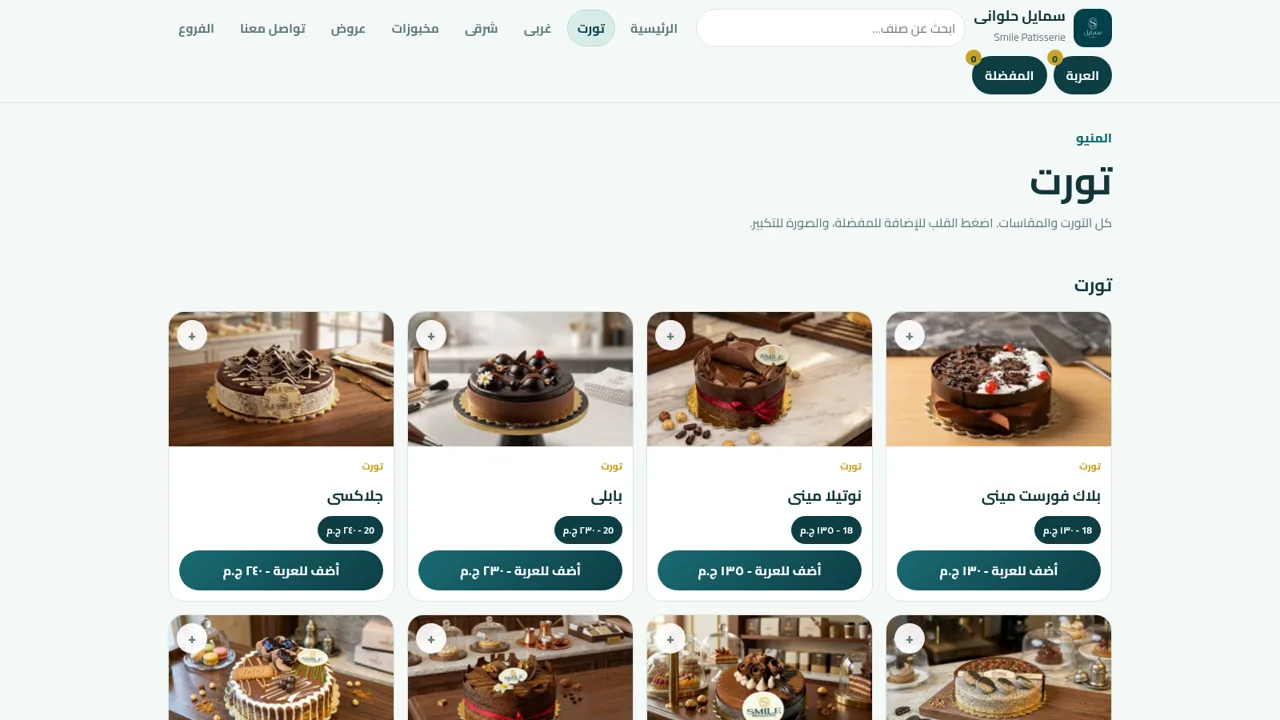
Smile Patisserie
Smile Patisserie menu: cakes, oriental, bakery, and WhatsApp cart
 500
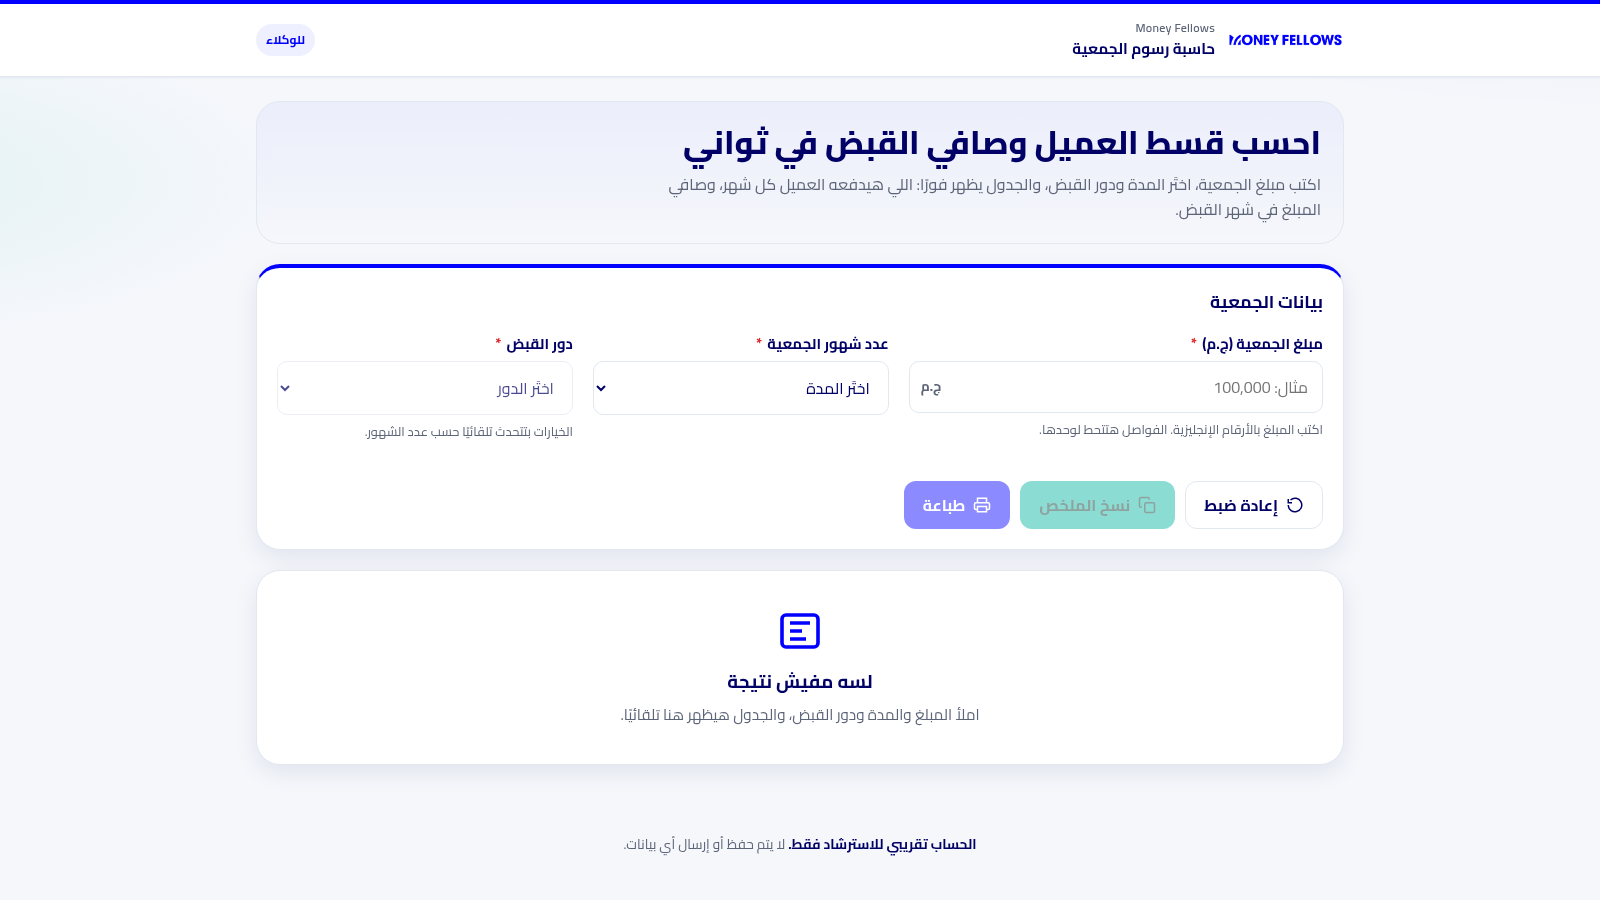
حاسبة رسوم الجمعية
حاسبة رسوم الجمعية لوكلاء Money Fellows — حساب القسط وصافي القبض شهر بشهر.
 51
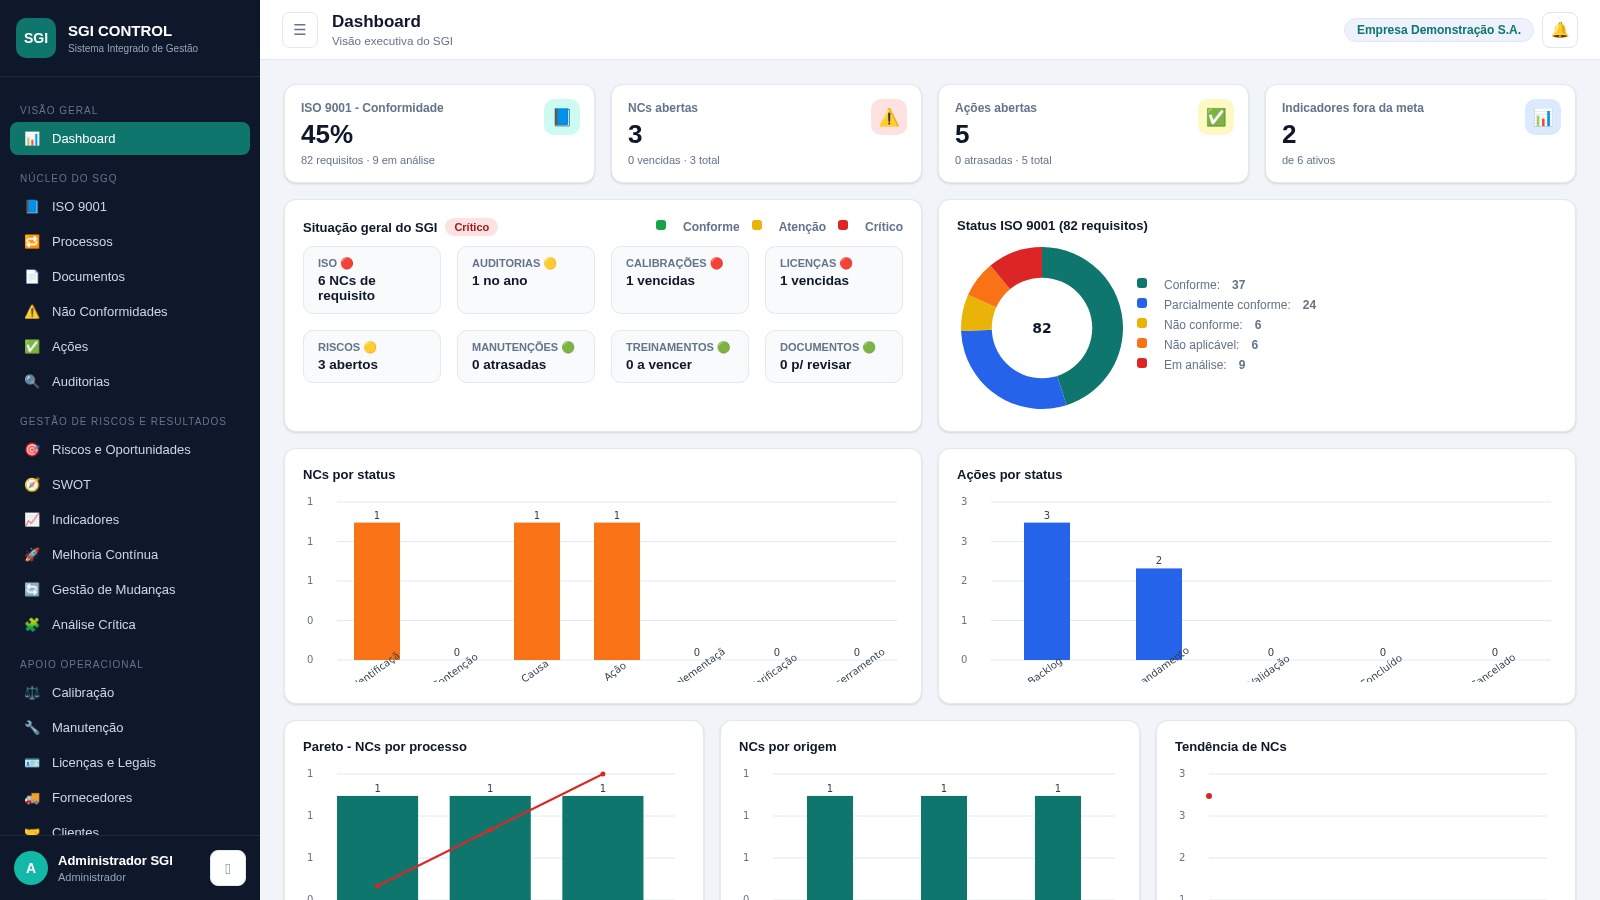
SGI CONTROL
Sistema Integrado de Gestão da Qualidade (ISO 9001) com painel B2B multiempresa
 126
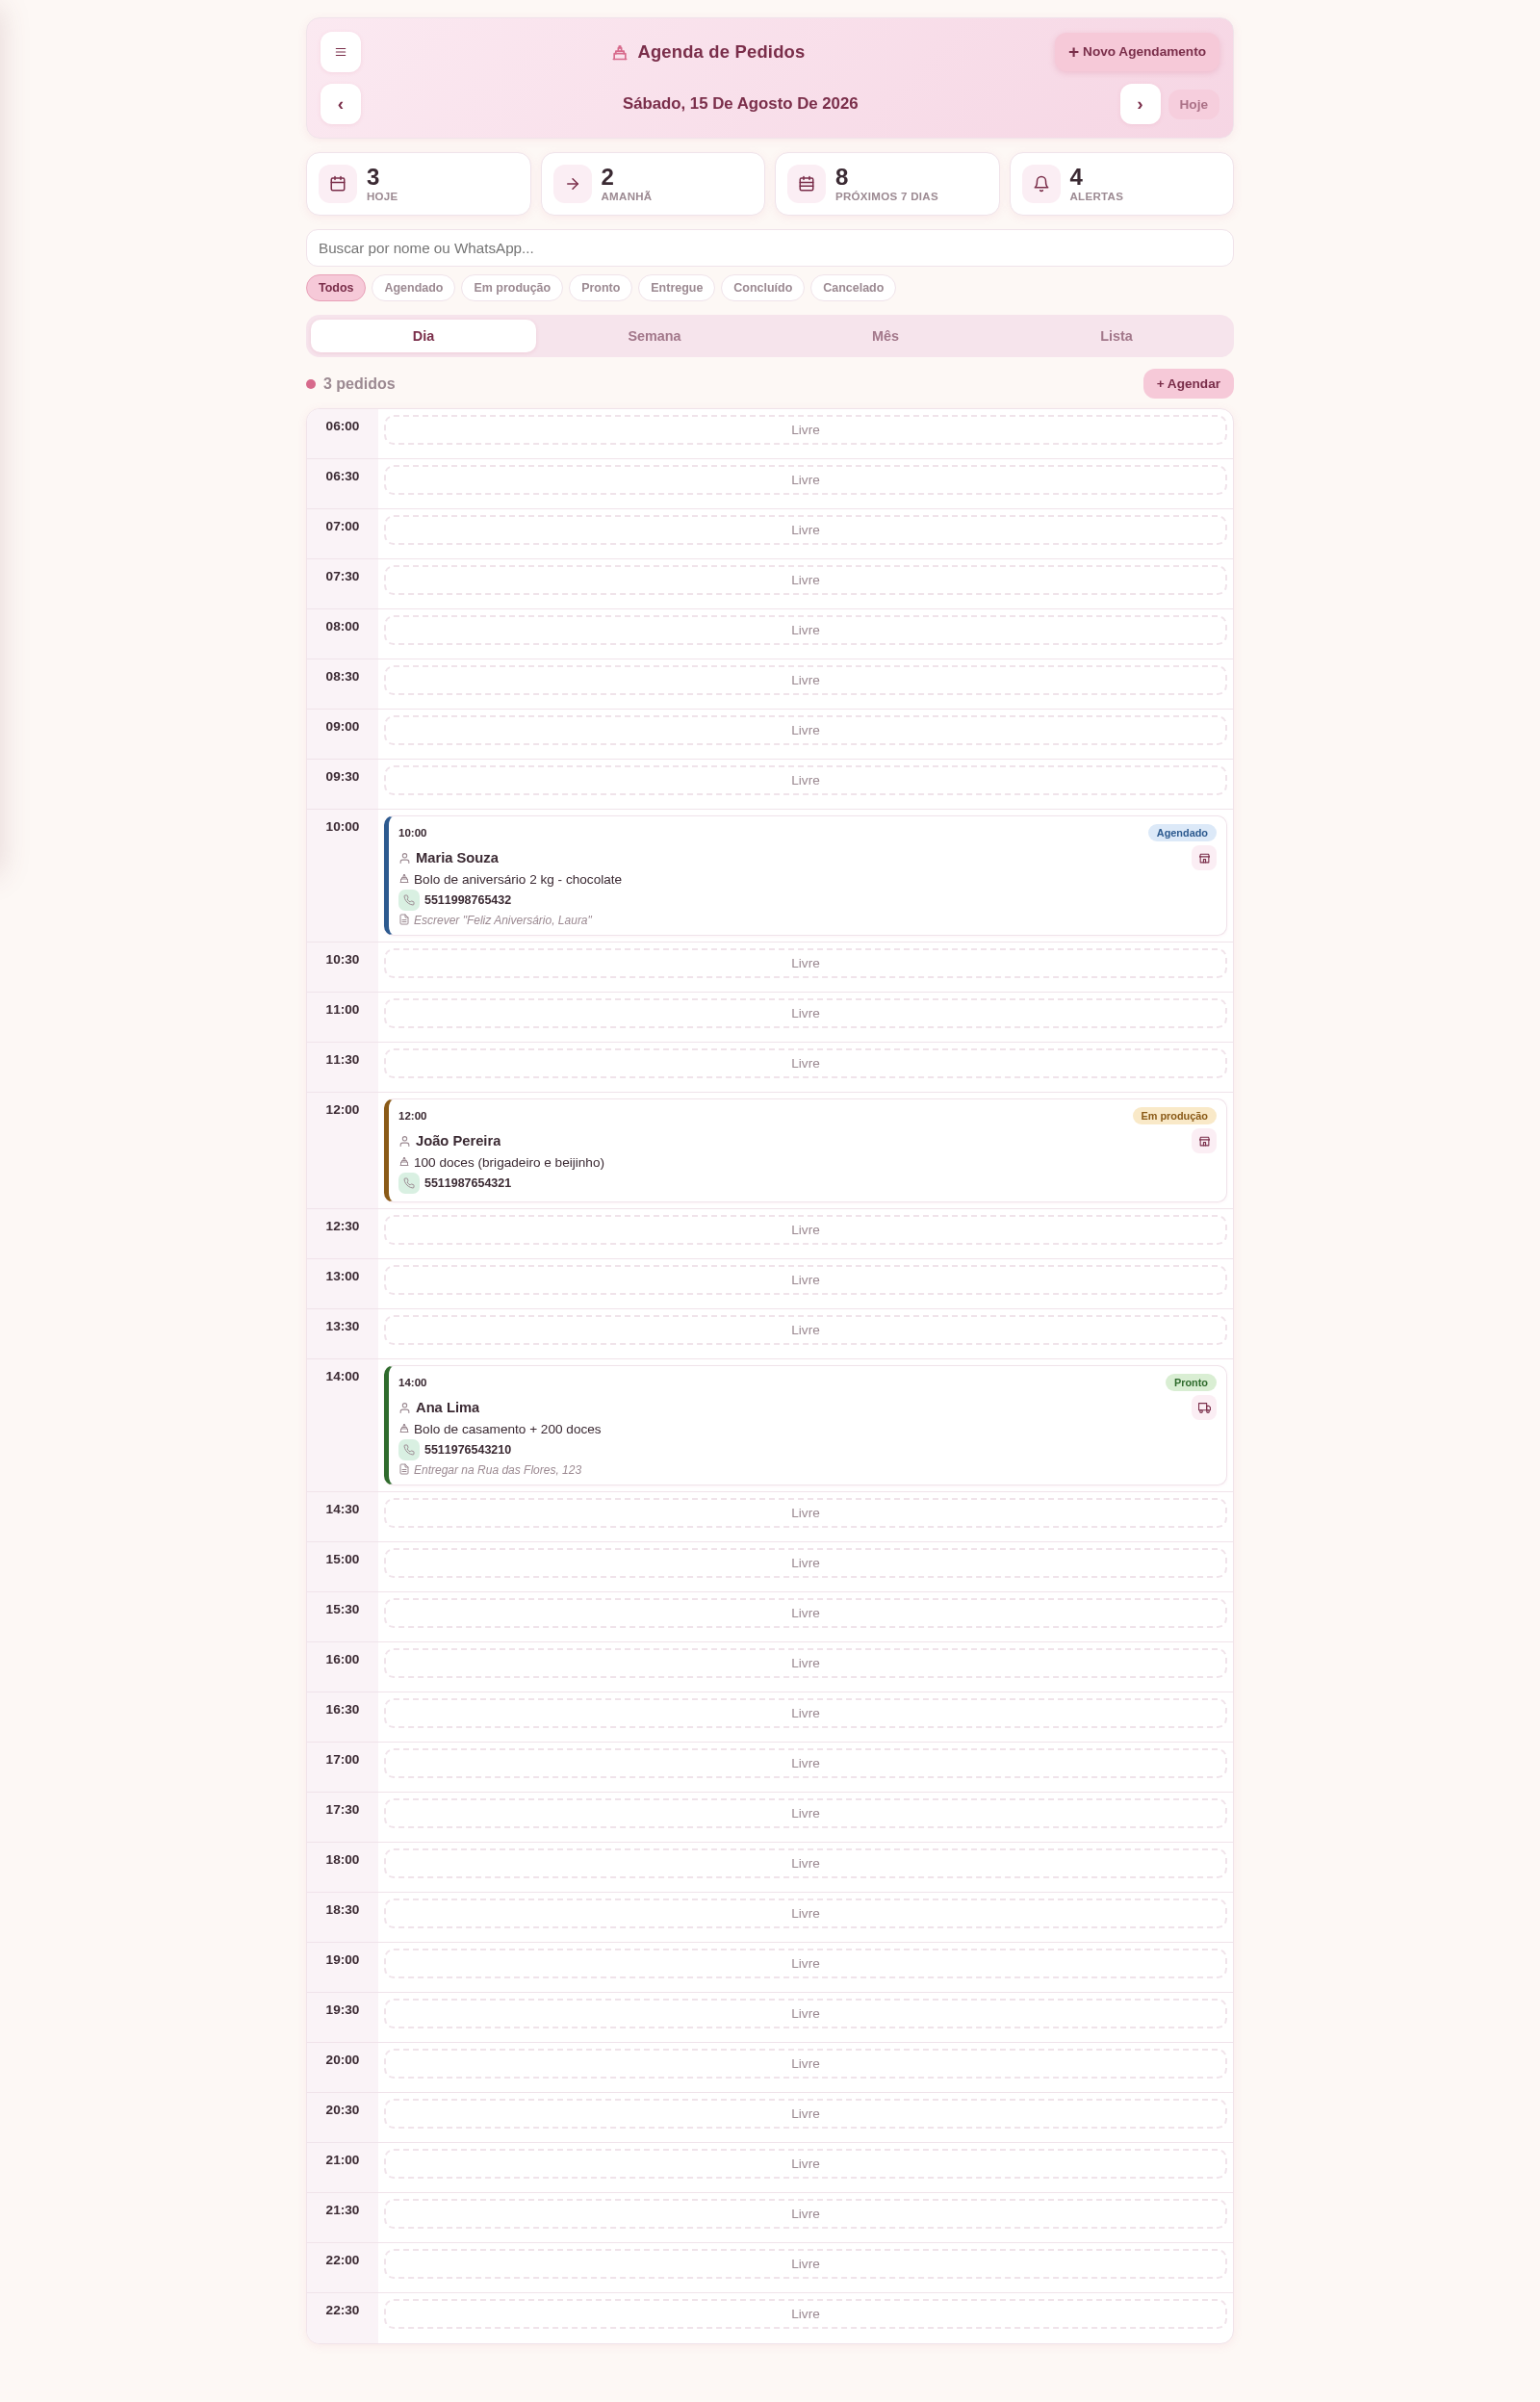
Agenda de Pedidos - Confeitaria
Agenda digital de pedidos para confeitaria com integração WhatsApp
 49
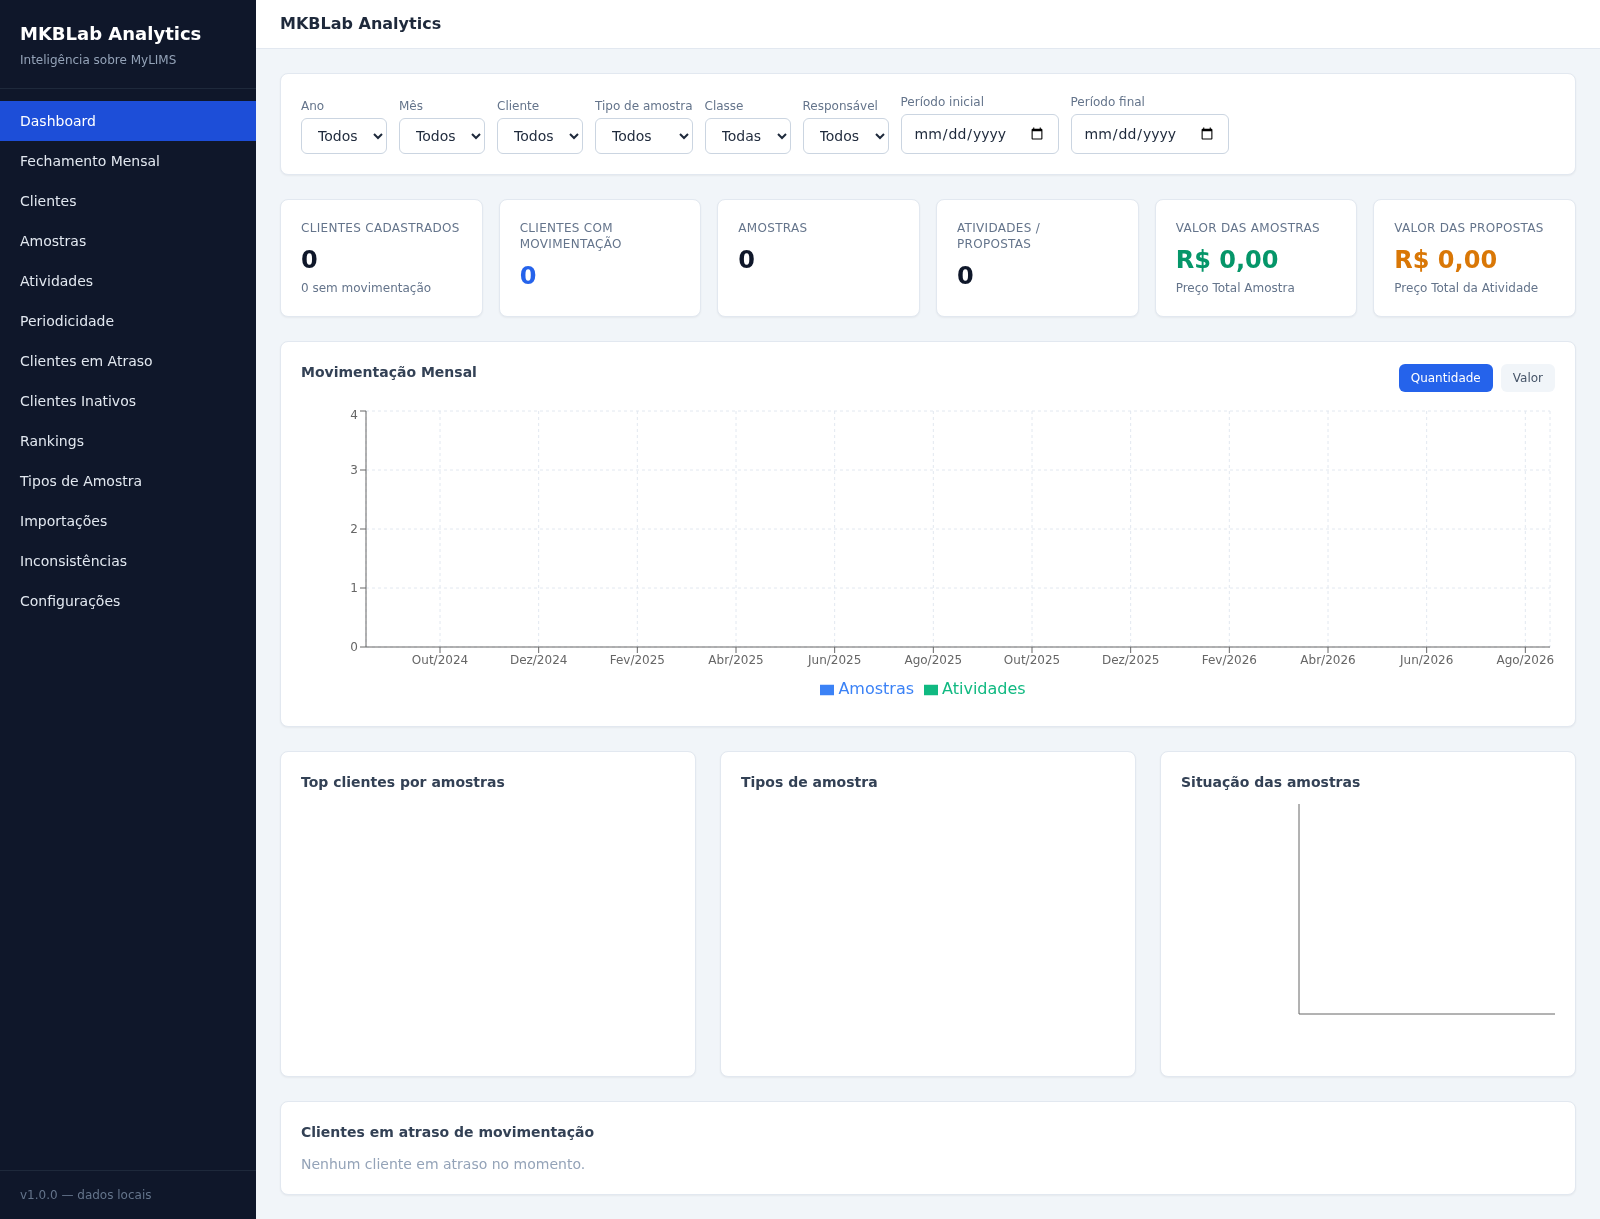
MKBLab Analytics
Dashboard gerencial com importação de relatórios XLSX do MyLIMS